

| VIRGINIA COAST RESERVE LONG-TERM ECOLOGICAL RESEARCH |
Site HOGI, Month FEB, Year 1994 |

| 
|
| Day of Month | Precip (mm) | Max Temp. oC | Min Temp. oC | Mean Temp. oC | Wind Speed (m/s) | Wind Dir (deg.) | Vapor Press. (mb) | Solar Rad. KJ/m2 | PAR uE/m2 |
|---|---|---|---|---|---|---|---|---|---|
| 1 | 0.00 | 5 | -2 | 0.5 | 0.93 | 332 | 5.35 | 11360 | 19627 |
| 2 | 0.00 | 1 | -7 | -1.9 | 2.15 | 36 | 4.08 | 4707 | 8545 |
| 3 | 0.00 | 8 | -6 | 1.2 | 1.08 | 232 | 4.88 | 13531 | 24075 |
| 4 | 0.00 | 8 | -0 | 3.5 | 1.47 | 157 | 6.50 | 9550 | 17876 |
| 5 | 0.00 | 8 | 4 | 5.2 | 1.03 | 202 | 7.97 | 1473 | 3641 |
| 6 | 0.00 | 7 | 0 | 3.7 | 0.95 | 50 | 7.75 | 12702 | 22579 |
| 7 | 0.00 | 13 | -2 | 4.2 | 0.77 | 191 | 6.81 | 13610 | 23905 |
| 8 | 0.00 | 9 | 3 | 5.2 | 1.21 | 177 | 7.90 | 4073 | 7611 |
| 9 | 0.00 | 12 | 0 | 4.8 | 1.28 | 18 | 8.79 | 1836 | 3827 |
| 10 | 0.00 | 0 | -6 | -3.5 | 3.10 | 19 | 4.19 | 2084 | 4248 |
| 11 | 0.00 | 3 | -0 | 1.5 | 2.87 | 15 | 6.94 | 1719 | 4940 |
| 12 | 0.00 | 1 | -1 | 0.1 | 1.60 | 350 | 6.27 | 2709 | 5178 |
| 13 | 0.00 | 3 | -0 | 1.4 | 1.36 | 277 | 6.69 | 3939 | 7203 |
| 14 | 0.00 | 7 | -2 | 2.2 | 1.42 | 303 | 5.37 | 15065 | 26495 |
| 15 | 7.90 | 14 | -1 | 6.1 | 1.42 | 192 | 6.68 | 15322 | 27422 |
| 16 | 0.00 | 9 | -1 | 4.9 | 1.19 | 317 | 5.67 | 15814 | 28044 |
| 17 | 0.00 | 10 | -2 | 3.6 | 0.73 | 146 | 6.85 | 15583 | 28414 |
| 18 | 2.00 | 12 | 2 | 6.3 | 0.96 | 177 | 8.38 | 15944 | 28515 |
| 19 | 0.00 | 16 | 2 | 8.2 | 0.80 | 133 | 9.39 | 15197 | 27194 |
| 20 | 0.00 | 17 | 4 | 9.8 | 1.11 | 146 | 11.31 | 15686 | 27859 |
| 21 | 1.60 | 17 | 8 | 11.0 | 0.94 | 249 | 13.24 | 8109 | 15180 |
| 22 | 0.30 | 10 | 4 | 6.6 | 1.93 | 42 | 9.06 | 12954 | 21594 |
| 23 | 14.60 | 11 | 4 | 7.0 | 2.02 | 82 | 10.03 | 1488 | 3098 |
| 24 | 21.30 | 11 | 4 | 7.2 | 1.59 | 289 | 8.95 | 10546 | 17677 |
| 25 | 0.00 | 11 | -2 | 4.8 | 1.36 | 190 | 6.19 | 16788 | 27582 |
| 26 | 0.00 | 9 | -1 | 4.1 | 3.48 | 319 | 5.74 | 17105 | 29058 |
| 27 | 0.00 | -1 | -5 | -2.6 | 3.65 | 332 | 2.70 | 17937 | 31186 |
| 28 | 0.00 | 3 | -5 | -1.2 | 1.30 | 341 | 2.86 | 18091 | 31292 |
| Mon. Tot. Precip. 47.7 mm | Mean wind vel. 1.561 m/s |
| Mon. Mean Temp. 3.7 deg. C | Wind dir 348 deg |
| Mean Max. Temp. 8.4 deg. C | Mean Min. Temp. -0.3 deg. C |
| Extreme Max. Temp 16.9 deg. C | Mean vapor press 7.02 mb |
| Extreme Min. Temp -6.8 deg. C | Total Solar Rad 294921 KJ/sq. m |
| Total photosyn. 523865 uEin/sq.m |
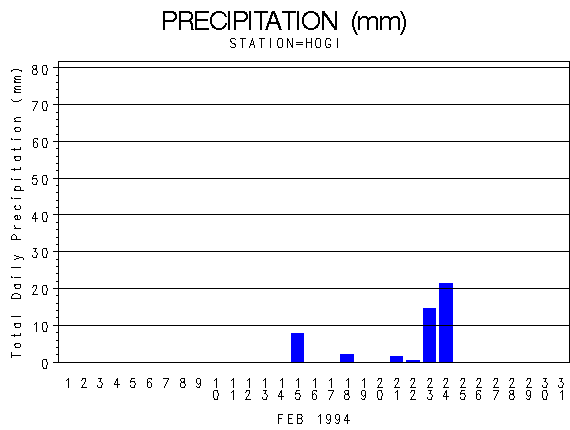 |
| Daily Total Precipitation (mm) |

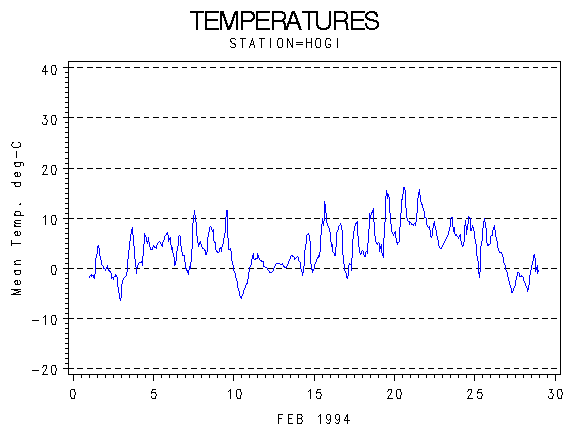 |
| Hourly Mean Temperatures (deg. C) |

 |
| Hourly Max Min and Mean Temperatures (deg. C) |

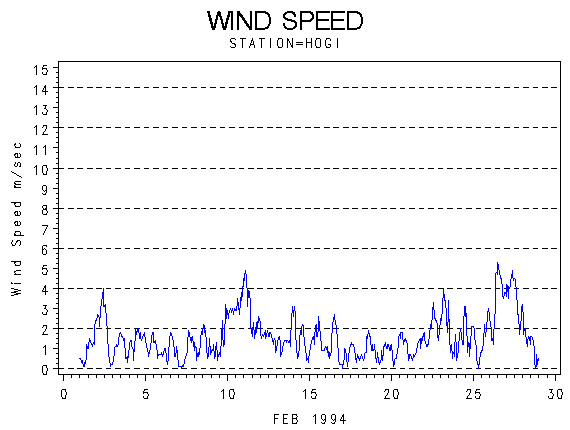 |
| Wind Speed (m/s) |

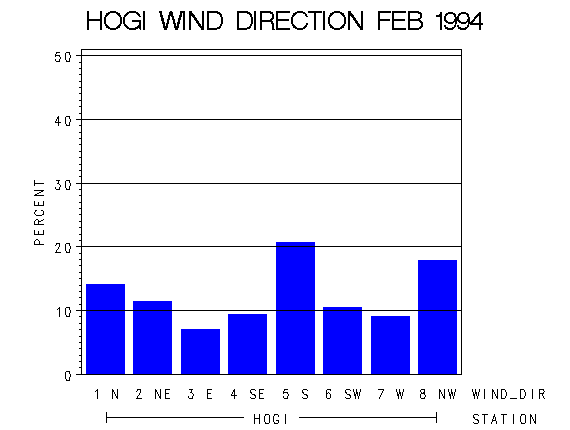 |
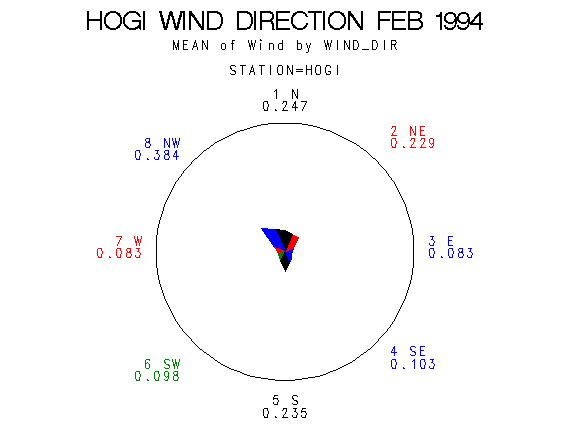
| Frequency of Wind Direction |

 |
| Wind Vectors (circle=1.5 m/s) |

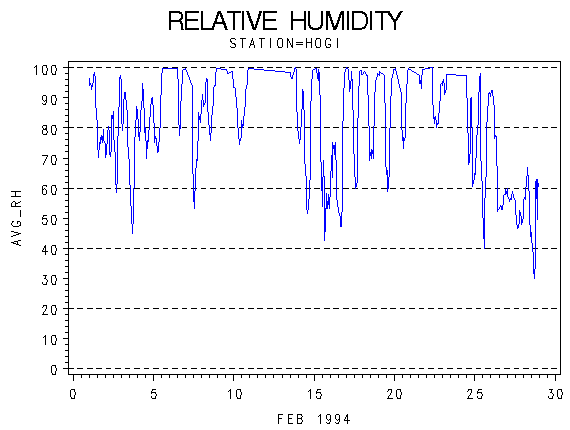 |
| Relative Humidity (percent) |

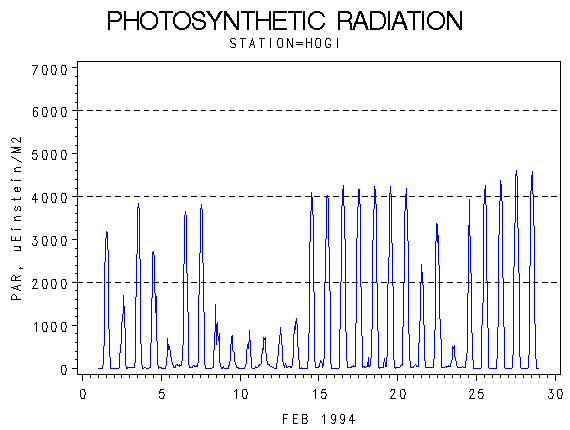 |
| Photosynthetically Active Radiation (micro-einsteins per m squared) |

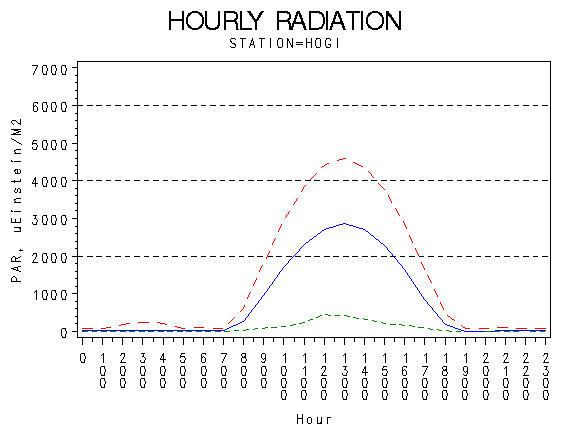 |
| Hourly Photosynthetically Active Radiation (micro-einsteins per m squared) |

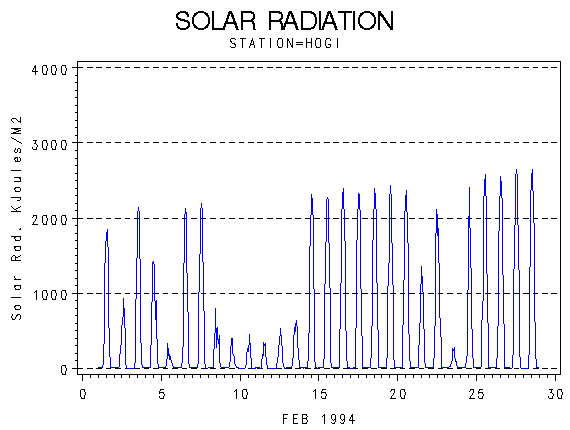 |
| Solar Radiation (KiloJoules per Meter Squared) |

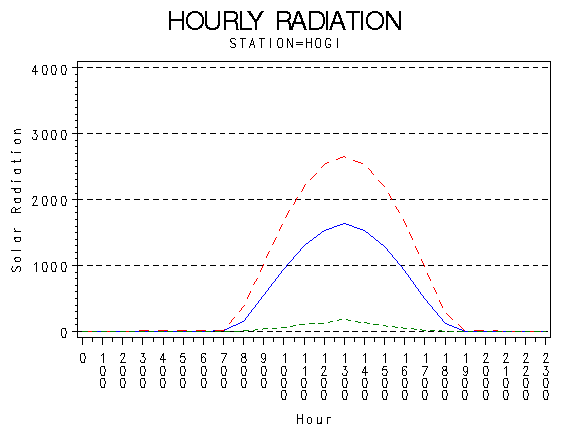 |
| Hourly Solar Radiation (KiloJoules per Meter Squared) |

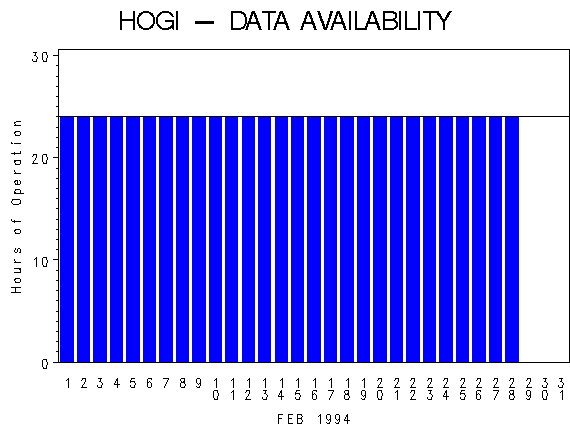 |
| Hours of Station Operation |

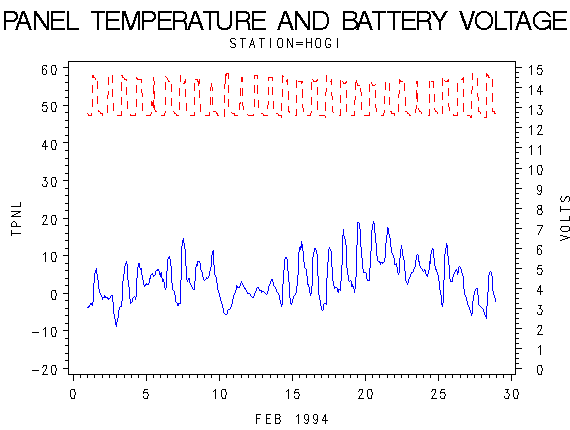 |
| Data Logger Battery Voltage and Internal Logger Temperature |
