
|
| VIRGINIA COAST RESERVE LONG-TERM ECOLOGICAL RESEARCH |
Site PHCK, Month DEC, Year 2004 |

| 
|
| Day of Month | Precip (mm) | Max Temp. oC | Min Temp. oC | Mean Temp. oC | Wind Speed (m/s) | Wind Dir (deg.) | Vapor Press. (mb) | Solar Rad. KJ/m2 | PAR mMoles/m2 |
|---|---|---|---|---|---|---|---|---|---|
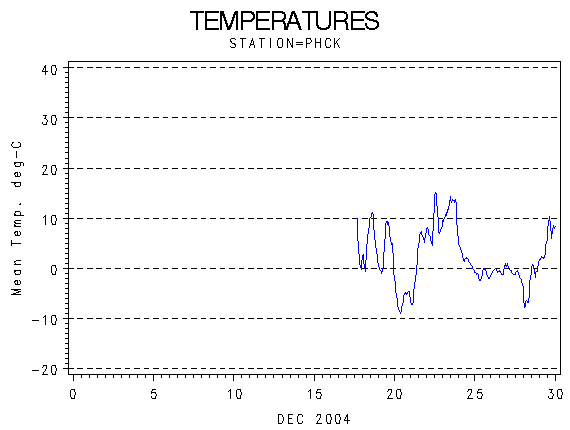
| 17 | 0.91 | 10 | -1 | 3.7 | 0.55 | 0 | 5.56 | 1422 | 29 |
| 18 | 4.02 | 12 | -1 | 5.5 | 1.14 | 0 | 7.69 | 7162 | 119 |
| 19 | 1.93 | 10 | -1 | 3.8 | 1.43 | 0 | 7.66 | 3601 | 60 |
| 20 | 5.24 | -1 | -9 | -6.1 | 5.60 | 0 | 2.71 | 9947 | 166 |
| 21 | 5.32 | 8 | -7 | 1.3 | 2.91 | 0 | 3.96 | 9535 | 159 |
| 22 | 5.36 | 16 | 3 | 8.7 | 1.42 | 0 | 7.37 | 9570 | 160 |
| 23 | 2.07 | 15 | 5 | 11.5 | 1.89 | 0 | 13.48 | 3779 | 63 |
| 24 | 2.44 | 5 | -1 | 1.8 | 3.25 | 0 | 5.04 | 4492 | 75 |
| 25 | 2.98 | 0 | -3 | -1.3 | 2.32 | 0 | 3.43 | 5357 | 89 |
| 26 | 0.48 | 1 | -2 | -0.6 | 3.34 | 0 | 5.30 | 633 | 11 |
| 27 | 5.57 | 1 | -3 | -1.0 | 4.98 | 0 | 3.19 | 10303 | 172 |
| 28 | 5.29 | 2 | -9 | -3.1 | 1.32 | 0 | 3.19 | 9255 | 154 |
| 29 | 5.26 | 11 | 1 | 5.3 | 3.06 | 0 | 5.81 | 9356 | 156 |
| 30 | 4.73 | 11 | 4 | 7.2 | 1.41 | 0 | 8.19 | 8446 | 141 |
| 31 | 3.75 | 12 | 2 | 7.5 | 0.65 | 0 | 10.09 | 6614 | 110 |
| Mon. Tot. Precip. 55.4 mm | Mean wind vel. 2.350 m/s |
| Mon. Mean Temp. 2.9 deg. C | Wind dir 0 deg |
| Mean Max. Temp. 7.5 deg. C | Mean Min. Temp. -1.5 deg. C |
| Extreme Max. Temp 15.7 deg. C | Mean vapor press 6.18 mb |
| Extreme Min. Temp -9.2 deg. C | Total Solar Rad 99473 KJ/sq. m |
| Total photosyn. 1664 mMoles/sq.m |
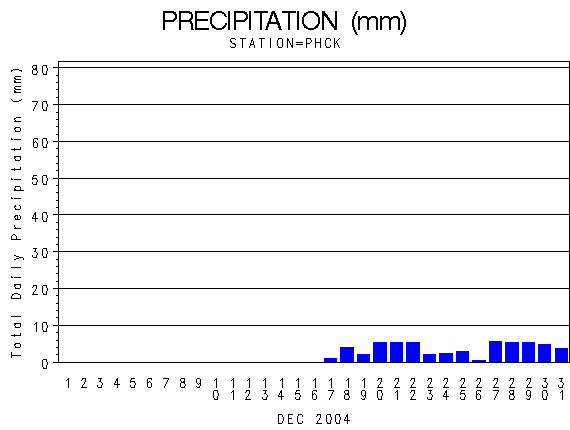 |
| Daily Total Precipitation (mm) |

 |
| Hourly Mean Temperatures (deg. C) |
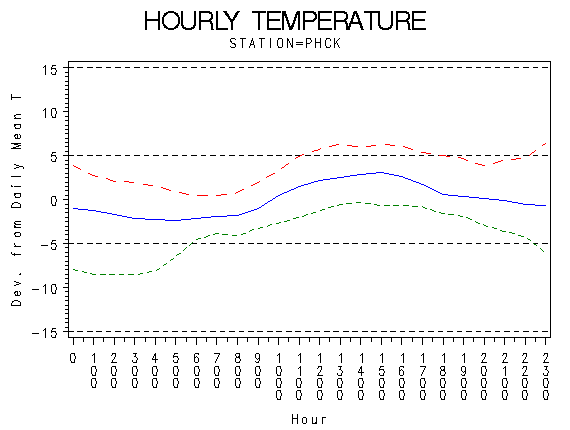 |
| Hourly Max Min and Mean Temperatures (deg. C) |
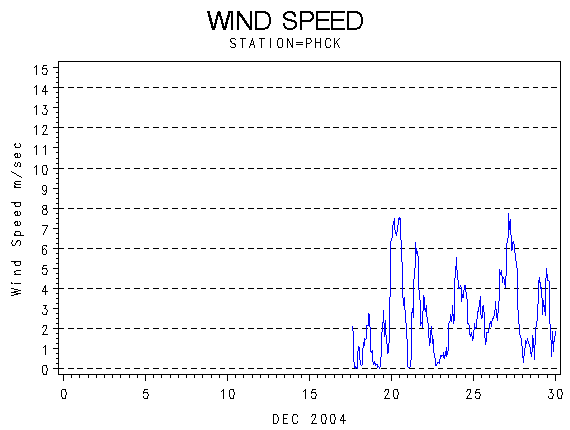 |
| Wind Speed (m/s) |
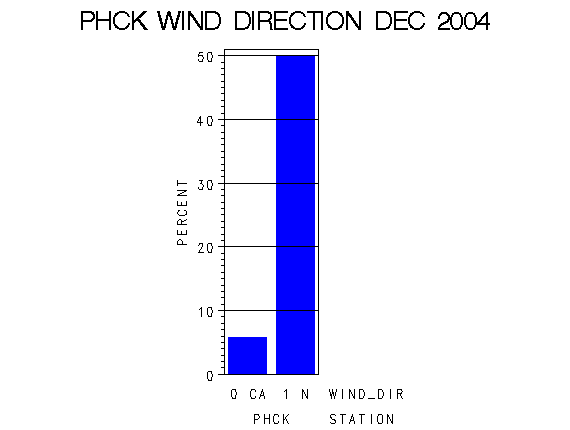 |
| Frequency of Wind Direction |
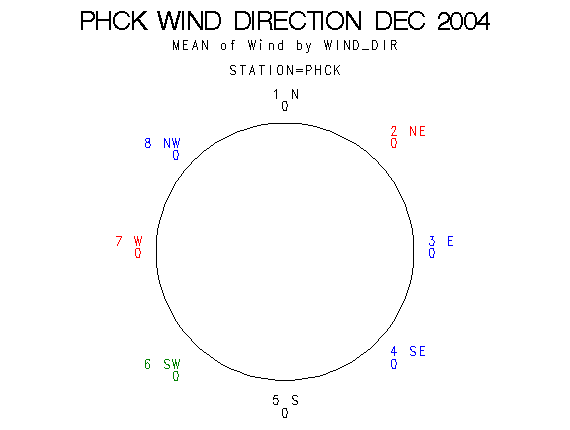 |
| Wind Vectors (circle=1.5 m/s) |
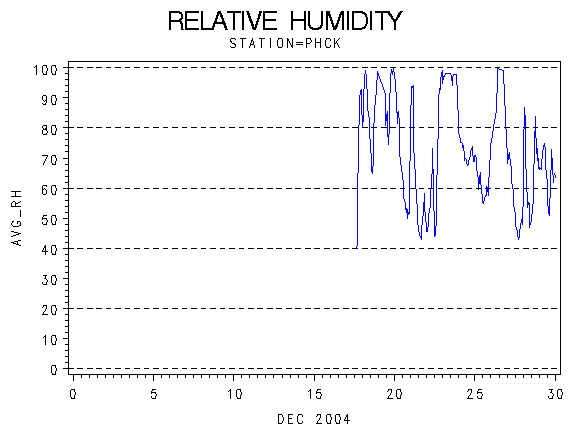 |
| Relative Humidity (percent) |
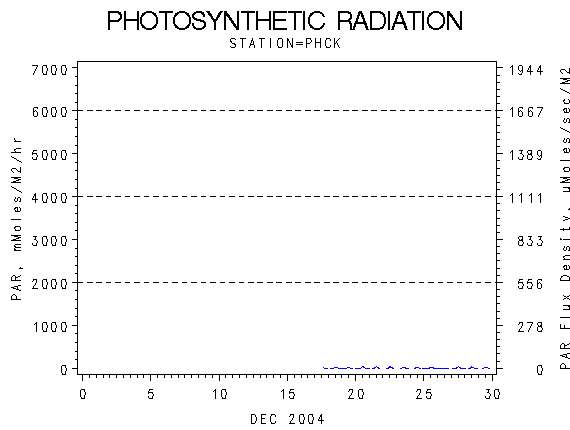 |
| Photosynthetically Active Radiation (milli-moles per m squared) |
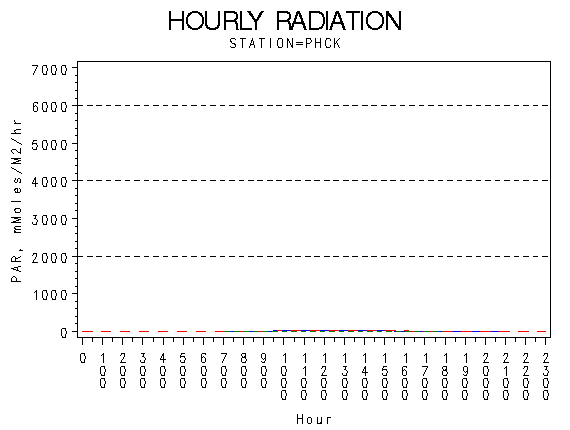 |
| Hourly Photosynthetically Active Radiation (milliMoles per m squared) |
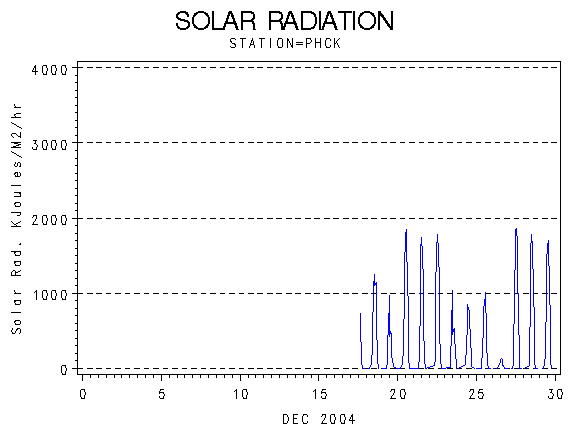 |
| Solar Radiation (KiloJoules per Meter Squared) |
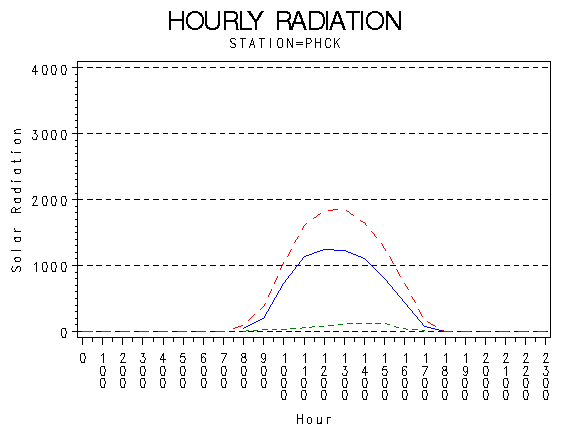 |
| Hourly Solar Radiation (KiloJoules per Meter Squared) |
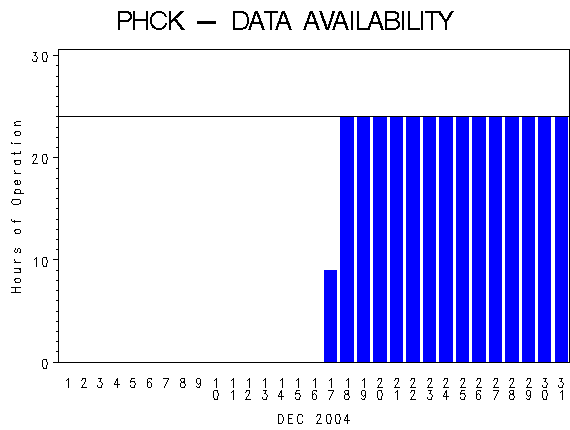 |
| Hours of Station Operation |
 |
| Data Logger Battery Voltage and Internal Logger Temperature |