

| VIRGINIA COAST RESERVE LONG-TERM ECOLOGICAL RESEARCH |
Site PHCK, Month SEP, Year 1999 |

| 
|
| Day of Month | Precip (mm) | Max Temp. oC | Min Temp. oC | Mean Temp. oC | Wind Speed (m/s) | Wind Dir (deg.) | Vapor Press. (mb) | Solar Rad. KJ/m2 | PAR uE/m2 |
|---|---|---|---|---|---|---|---|---|---|
| 1 | 0.25 | 23 | 19 | 21.0 | 2.13 | 325 | 22.00 | 3819 | 6256 |
| 2 | 5.84 | 25 | 21 | 22.8 | 3.77 | 27 | 26.38 | 5061 | 8553 |
| 3 | 0.25 | 26 | 23 | 23.9 | 3.95 | 149 | 27.99 | 7221 | 11660 |
| 4 | 20.83 | 25 | 24 | 24.4 | 4.01 | 103 | 29.57 | 3940 | 6728 |
| 5 | 2.54 | 28 | 24 | 25.7 | 0.91 | 87 | 30.64 | 21111 | 31501 |
| 6 | 0.00 | 30 | 24 | 26.1 | 0.08 | 88 | 30.72 | 14995 | 22002 |
| 7 | 31.49 | 29 | 23 | 25.0 | 0.60 | 86 | 29.91 | 9898 | 14707 |
| 8 | 0.51 | 30 | 23 | 25.9 | 0.50 | 85 | 30.44 | 19586 | 27742 |
| 9 | 27.94 | 30 | 22 | 25.0 | 0.36 | 86 | 29.84 | 12650 | 18367 |
| 10 | 31.24 | 28 | 20 | 22.8 | 0.90 | 85 | 25.41 | 15029 | 21385 |
| 11 | 0.25 | 26 | 15 | 20.9 | 0.60 | 85 | 17.64 | 22390 | 31245 |
| 12 | 0.00 | 27 | 13 | 19.9 | 0.03 | 85 | 16.81 | 21797 | 30899 |
| 13 | 0.00 | 26 | 15 | 21.5 | 0.02 | 85 | 22.19 | 14732 | 21782 |
| 14 | 8.13 | 25 | 20 | 22.7 | 0.11 | 86 | 25.64 | 4872 | 7710 |
| 15 | 53.60 | 24 | 21 | 22.8 | 2.10 | 86 | 27.55 | 2198 | 3859 |
| 16 | 52.58 | 25 | 18 | 22.2 | 4.33 | 84 | 25.11 | 2516 | 4559 |
| 17 | 0.00 | 23 | 13 | 18.6 | 2.43 | 4 | 14.85 | 21486 | 30679 |
| 18 | 0.00 | 24 | 12 | 17.1 | 0.10 | 0 | 14.65 | 18861 | 29996 |
| 19 | 0.00 | 24 | 11 | 17.8 | 0.03 | 329 | 16.08 | 15108 | 23613 |
| 20 | 0.00 | 25 | 13 | 19.9 | 0.04 | 330 | 20.13 | 19655 | 31578 |
| 21 | 1.78 | 23 | 15 | 20.3 | 0.70 | 333 | 21.96 | 6671 | 11092 |
| 22 | 0.00 | 18 | 13 | 15.1 | 3.09 | 328 | 13.65 | 13934 | 21747 |
| 23 | 0.00 | 23 | 9 | 16.4 | 0.70 | 309 | 12.49 | 20528 | 30952 |
| 24 | 0.00 | 25 | 12 | 19.0 | 1.02 | 306 | 15.44 | 19789 | 30230 |
| 25 | 0.00 | 28 | 12 | 19.9 | 0.72 | 310 | 18.44 | 16648 | 26656 |
| 26 | 0.00 | 26 | 15 | 20.8 | 0.01 | 311 | 23.16 | 17435 | 28274 |
| 27 | 0.00 | 26 | 21 | 23.2 | 0.03 | 312 | 26.53 | 13139 | 22165 |
| 28 | 0.00 | 25 | 21 | 22.8 | 0.02 | 315 | 25.59 | 7634 | 13493 |
| 29 | 0.00 | 27 | 21 | 23.4 | 0.05 | 301 | 24.69 | 16773 | 27827 |
| 30 | 9.39 | 24 | 12 | 19.1 | 2.82 | 326 | 15.99 | 19368 | 30757 |
| Mon. Tot. Precip. 246.6 mm | Mean wind vel. 1.205 m/s |
| Mon. Mean Temp. 21.5 deg. C | Wind dir 20 deg |
| Mean Max. Temp. 25.6 deg. C | Mean Min. Temp. 17.6 deg. C |
| Extreme Max. Temp 30.3 deg. C | Mean vapor press 22.72 mb |
| Extreme Min. Temp 9.3 deg. C | Total Solar Rad 408844 KJ/sq. m |
| Total photosyn. 628014 uEin/sq.m |
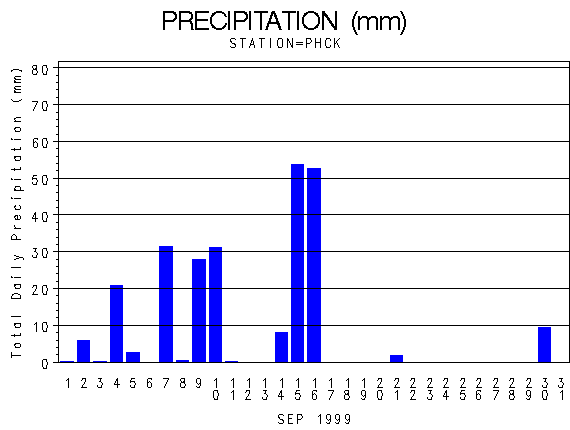 |
| Daily Total Precipitation (mm) |

 |
| Hourly Mean Temperatures (deg. C) |

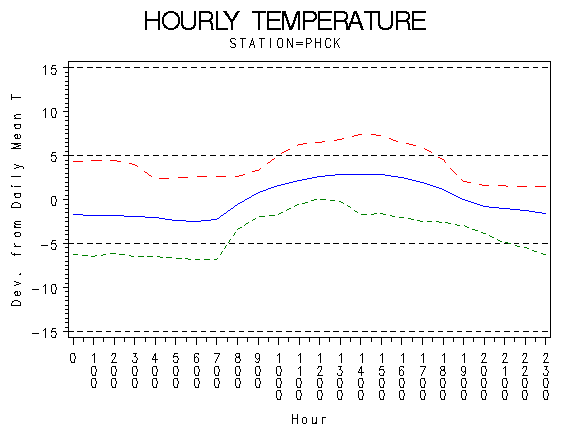 |
| Hourly Max Min and Mean Temperatures (deg. C) |

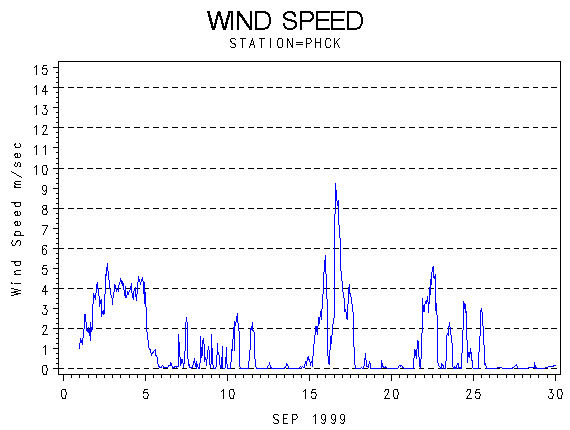 |
| Wind Speed (m/s) |

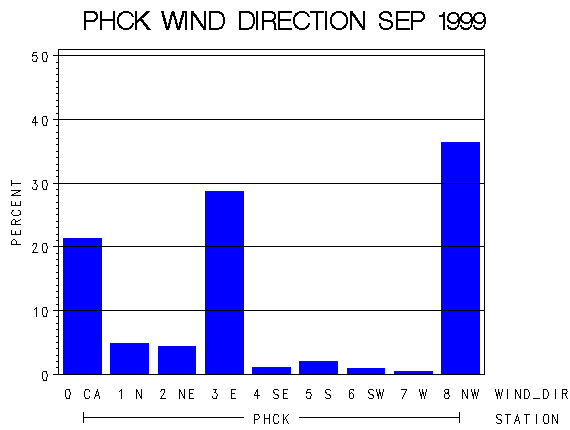 |
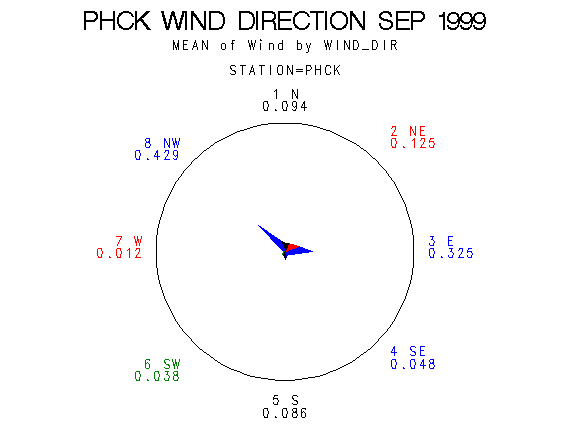
| Frequency of Wind Direction |

 |
| Wind Vectors (circle=1.5 m/s) |

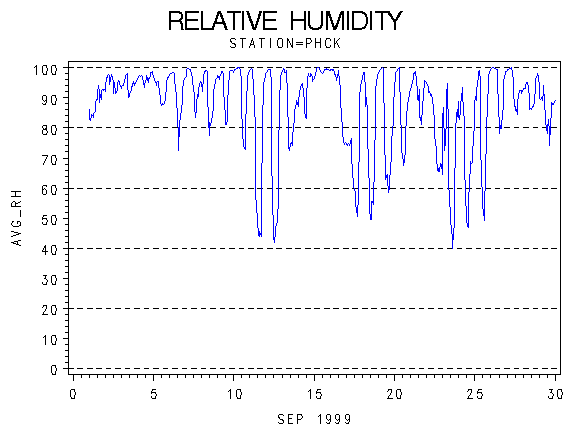 |
| Relative Humidity (percent) |

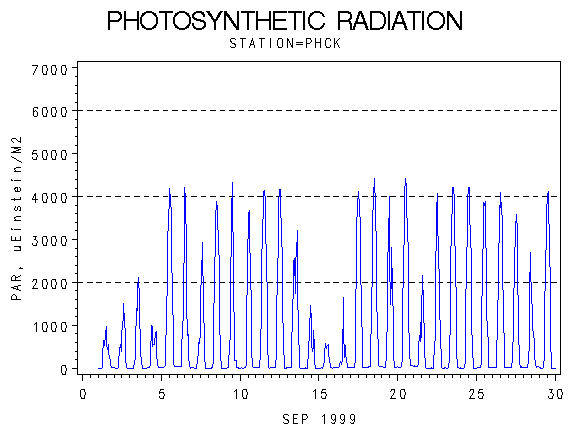 |
| Photosynthetically Active Radiation (micro-einsteins per m squared) |

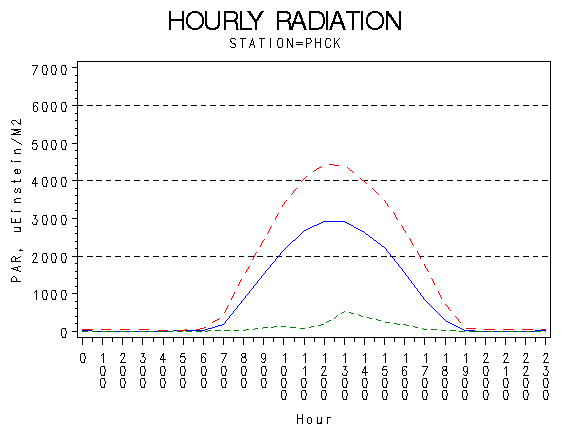 |
| Hourly Photosynthetically Active Radiation (micro-einsteins per m squared) |

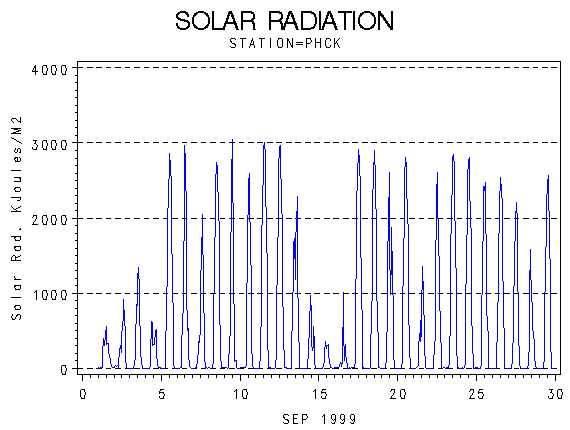 |
| Solar Radiation (KiloJoules per Meter Squared) |

 |
| Hourly Solar Radiation (KiloJoules per Meter Squared) |

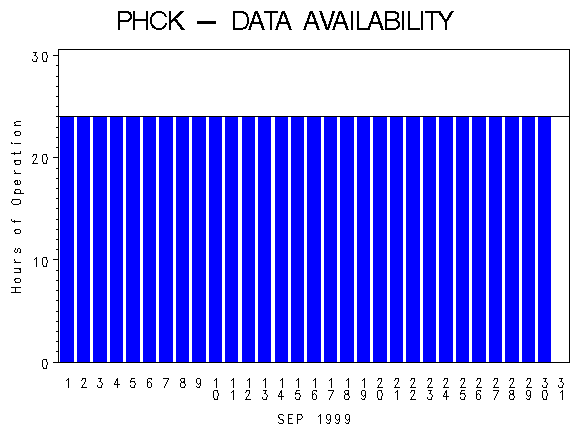 |
| Hours of Station Operation |

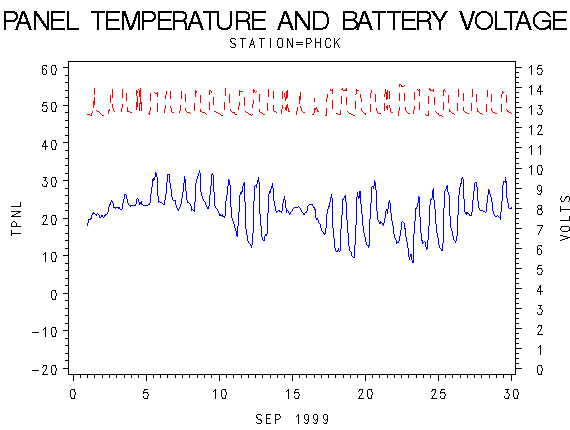 |
| Data Logger Battery Voltage and Internal Logger Temperature |
