

| VIRGINIA COAST RESERVE LONG-TERM ECOLOGICAL RESEARCH |
Site PHCK, Month SEP, Year 1998 |

| 
|
| Day of Month | Precip (mm) | Max Temp. oC | Min Temp. oC | Mean Temp. oC | Wind Speed (m/s) | Wind Dir (deg.) | Vapor Press. (mb) | Solar Rad. KJ/m2 | PAR uE/m2 |
|---|---|---|---|---|---|---|---|---|---|
| 1 | 0.00 | 27 | 22 | 24.7 | 1.67 | 61 | 27.91 | 7456 | 11992 |
| 2 | 0.00 | 29 | 22 | 25.5 | 1.36 | 192 | 27.30 | 13994 | 21170 |
| 3 | 2.79 | 29 | 22 | 25.3 | 1.70 | 179 | 28.36 | 10490 | 17827 |
| 4 | 54.36 | 26 | 20 | 22.8 | 2.25 | 38 | 26.25 | 9569 | 15933 |
| 5 | 0.00 | 27 | 18 | 22.6 | 0.92 | 323 | 21.41 | 22170 | 32931 |
| 6 | 0.25 | 31 | 17 | 24.7 | 2.13 | 200 | 25.17 | 20802 | 30966 |
| 7 | 0.00 | 34 | 24 | 28.3 | 3.38 | 208 | 28.90 | 20311 | 30388 |
| 8 | 11.69 | 29 | 16 | 21.4 | 2.38 | 291 | 18.84 | 11982 | 19420 |
| 9 | 0.00 | 22 | 15 | 18.5 | 2.75 | 294 | 12.86 | 20504 | 32001 |
| 10 | 0.00 | 23 | 13 | 18.6 | 2.07 | 301 | 14.27 | 21517 | 35529 |
| 11 | 0.00 | 26 | 13 | 19.0 | 0.90 | 265 | 15.79 | 21258 | 33986 |
| 12 | 0.00 | 31 | 16 | 23.1 | 1.05 | 239 | 18.78 | 21094 | 33246 |
| 13 | 0.00 | 31 | 18 | 23.8 | 0.95 | 24 | 23.89 | 18634 | 30850 |
| 14 | 0.00 | 28 | 21 | 24.1 | 0.36 | 99 | 26.61 | 18870 | 29762 |
| 15 | 0.00 | 30 | 21 | 24.7 | 0.66 | 189 | 27.57 | 18865 | 29126 |
| 16 | 0.00 | 31 | 21 | 25.9 | 2.06 | 210 | 27.45 | 17468 | 27555 |
| 17 | 0.00 | 31 | 21 | 25.2 | 0.89 | 218 | 27.33 | 13109 | 21362 |
| 18 | 0.00 | 26 | 22 | 24.2 | 1.88 | 64 | 27.56 | 9153 | 14448 |
| 19 | 0.00 | 27 | 23 | 24.2 | 2.27 | 64 | 26.89 | 11982 | 19165 |
| 20 | 0.00 | 27 | 20 | 23.3 | 0.72 | 48 | 24.82 | 18525 | 29553 |
| 21 | 0.00 | 30 | 19 | 24.5 | 0.67 | 192 | 26.10 | 17935 | 28206 |
| 22 | 10.16 | 29 | 21 | 24.6 | 1.41 | 246 | 27.73 | 12576 | 19658 |
| 23 | 0.00 | 21 | 11 | 17.6 | 2.29 | 8 | 13.60 | 20272 | 30240 |
| 24 | 0.00 | 23 | 8 | 15.9 | 0.59 | 162 | 12.05 | 20244 | 30811 |
| 25 | 0.00 | 26 | 13 | 20.2 | 0.78 | 192 | 17.96 | 18366 | 29382 |
| 26 | 0.00 | 29 | 17 | 23.1 | 0.75 | 216 | 22.92 | 17175 | 28011 |
| 27 | 0.00 | 32 | 21 | 26.6 | 3.31 | 213 | 24.25 | 17563 | 28205 |
| 28 | 0.00 | 31 | 22 | 26.1 | 2.28 | 267 | 24.37 | 16596 | 28083 |
| 29 | 0.00 | 25 | 17 | 21.6 | 0.97 | 57 | 19.16 | 17612 | 29809 |
| 30 | 29.46 | 27 | 18 | 23.0 | 1.13 | 186 | 25.06 | 14715 | 22647 |
| Mon. Tot. Precip. 108.7 mm | Mean wind vel. 1.551 m/s |
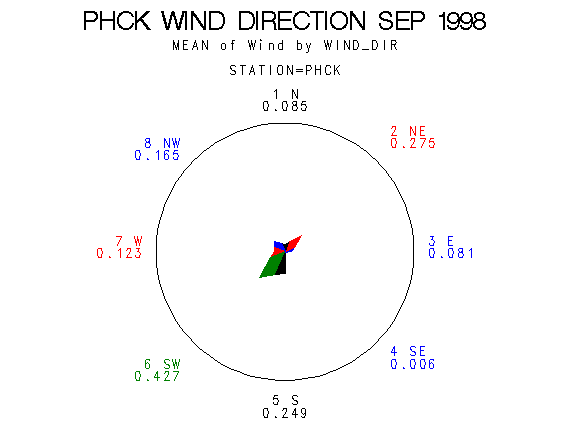
| Mon. Mean Temp. 23.1 deg. C | Wind dir 235 deg |
| Mean Max. Temp. 27.9 deg. C | Mean Min. Temp. 18.4 deg. C |
| Extreme Max. Temp 33.7 deg. C | Mean vapor press 23.04 mb |
| Extreme Min. Temp 7.6 deg. C | Total Solar Rad 500808 KJ/sq. m |
| Total photosyn. 792263 uEin/sq.m |
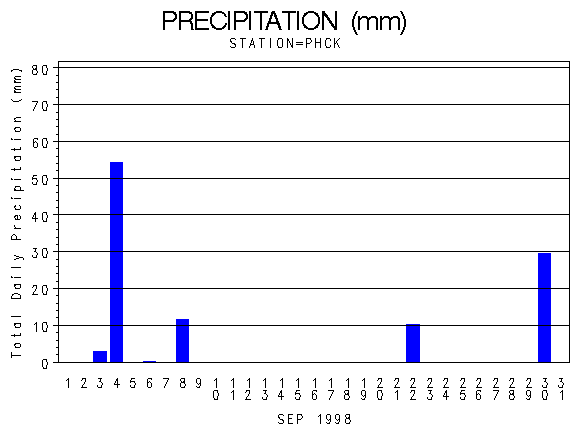 |
| Daily Total Precipitation (mm) |

 |
| Hourly Mean Temperatures (deg. C) |

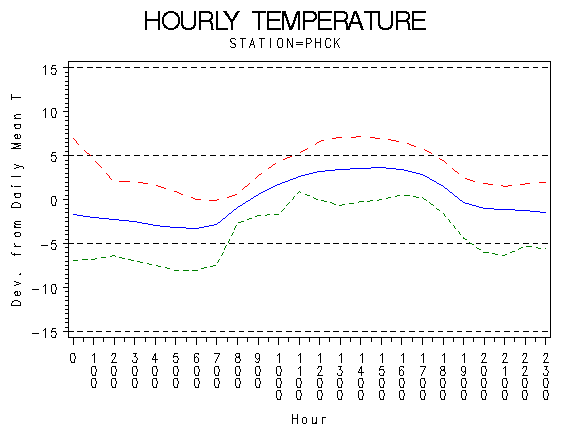 |
| Hourly Max Min and Mean Temperatures (deg. C) |

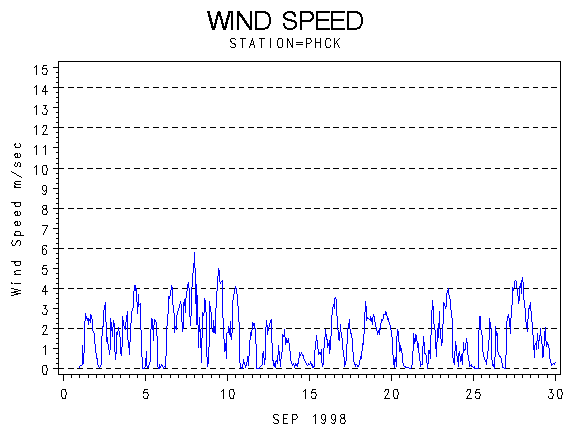 |
| Wind Speed (m/s) |

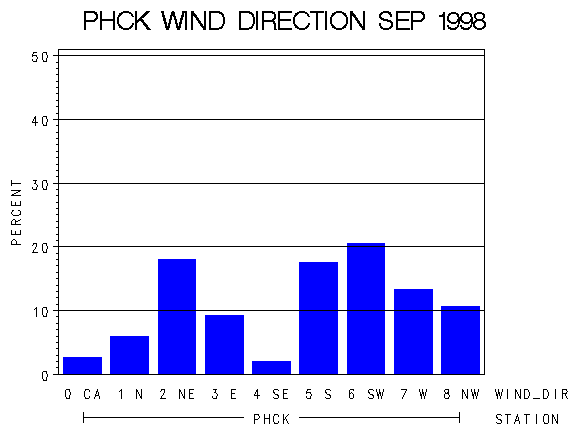 |
| Frequency of Wind Direction |

 |
| Wind Vectors (circle=1.5 m/s) |

 |
| Relative Humidity (percent) |

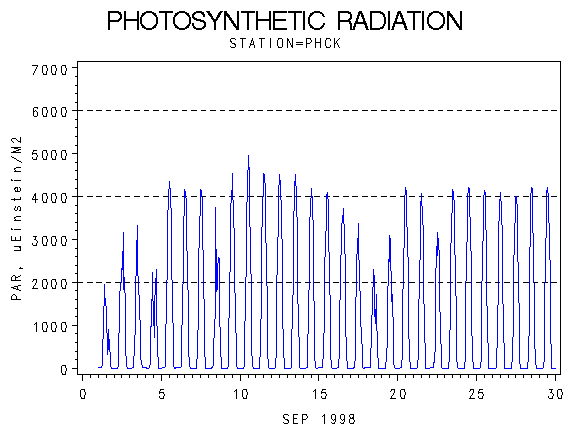 |
| Photosynthetically Active Radiation (micro-einsteins per m squared) |

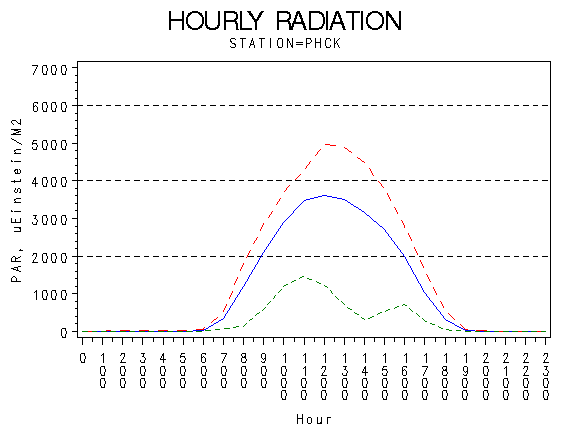 |
| Hourly Photosynthetically Active Radiation (micro-einsteins per m squared) |

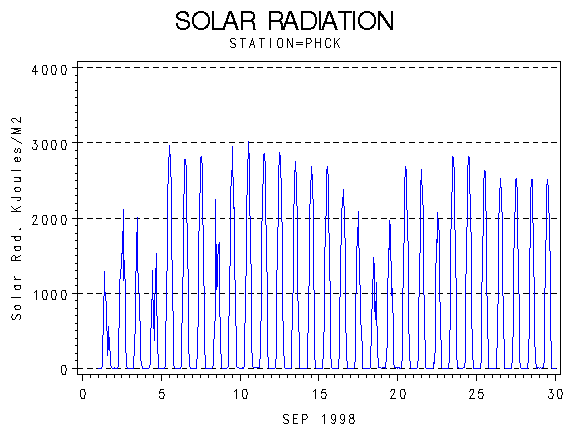 |
| Solar Radiation (KiloJoules per Meter Squared) |

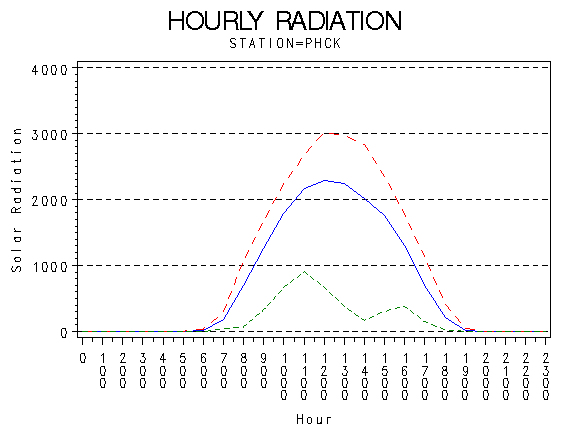 |
| Hourly Solar Radiation (KiloJoules per Meter Squared) |

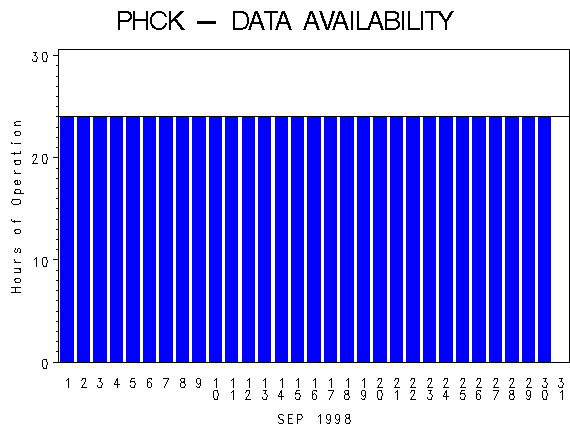 |
| Hours of Station Operation |

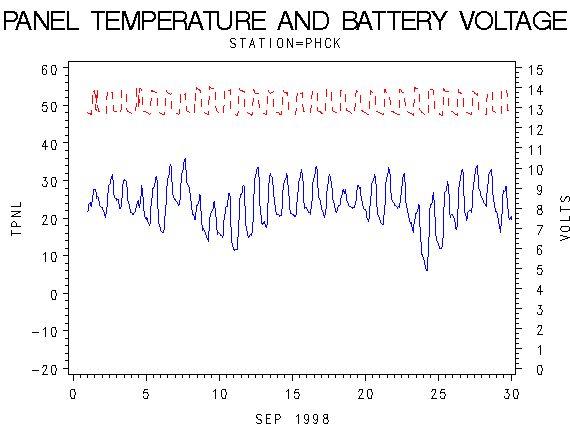 |
| Data Logger Battery Voltage and Internal Logger Temperature |
