
|
| VIRGINIA COAST RESERVE LONG-TERM ECOLOGICAL RESEARCH |
Site PHCK, Month JUN, Year 1998 |

| 
|
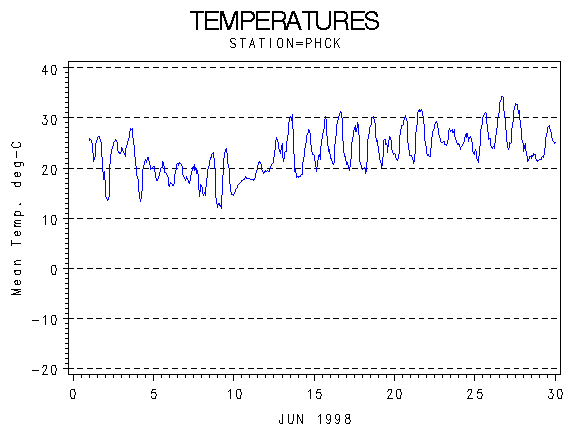
| Day of Month | Precip (mm) | Max Temp. oC | Min Temp. oC | Mean Temp. oC | Wind Speed (m/s) | Wind Dir (deg.) | Vapor Press. (mb) | Solar Rad. KJ/m2 | PAR uE/m2 |
|---|---|---|---|---|---|---|---|---|---|
| 1 | 0.00 | 27 | 16 | 23.8 | 2.60 | 299 | 21.37 | 22839 | 39430 |
| 2 | 0.00 | 26 | 13 | 21.0 | 0.91 | 175 | 19.63 | 26348 | 44440 |
| 3 | 0.51 | 29 | 18 | 24.2 | 2.22 | 258 | 21.36 | 26388 | 45692 |
| 4 | 0.00 | 23 | 13 | 18.9 | 0.95 | 129 | 15.59 | 21003 | 36589 |
| 5 | 0.25 | 22 | 16 | 19.0 | 1.00 | 61 | 16.01 | 14828 | 26386 |
| 6 | 0.00 | 22 | 16 | 18.8 | 1.46 | 327 | 14.05 | 23804 | 41363 |
| 7 | 0.00 | 21 | 14 | 18.3 | 2.49 | 283 | 10.64 | 21142 | 36504 |
| 8 | 0.00 | 24 | 12 | 18.3 | 2.20 | 266 | 11.14 | 26746 | 45286 |
| 9 | 9.40 | 24 | 11 | 17.3 | 0.77 | 324 | 13.30 | 17567 | 30707 |
| 10 | 7.87 | 18 | 15 | 17.0 | 0.92 | 82 | 18.43 | 3062 | 6092 |
| 11 | 8.63 | 22 | 17 | 19.1 | 1.11 | 69 | 20.68 | 10698 | 19629 |
| 12 | 25.65 | 27 | 19 | 21.9 | 0.93 | 161 | 25.02 | 10254 | 18567 |
| 13 | 23.63 | 31 | 18 | 24.4 | 1.79 | 210 | 24.95 | 19502 | 35012 |
| 14 | 0.00 | 28 | 18 | 22.7 | 2.24 | 222 | 21.08 | 26614 | 46616 |
| 15 | 5.33 | 31 | 19 | 24.3 | 1.25 | 173 | 26.32 | 19905 | 35405 |
| 16 | 9.40 | 32 | 20 | 25.6 | 2.12 | 193 | 25.42 | 24645 | 43479 |
| 17 | 20.32 | 29 | 19 | 23.9 | 1.59 | 222 | 23.30 | 22972 | 40791 |
| 18 | 0.00 | 31 | 18 | 25.2 | 1.67 | 228 | 23.41 | 26253 | 45856 |
| 19 | 0.00 | 27 | 20 | 23.7 | 1.34 | 200 | 25.01 | 10757 | 19665 |
| 20 | 0.00 | 31 | 21 | 25.8 | 1.71 | 259 | 26.37 | 26161 | 46157 |
| 21 | 0.00 | 32 | 21 | 26.8 | 0.94 | 222 | 26.31 | 24938 | 41689 |
| 22 | 0.00 | 30 | 22 | 25.8 | 0.64 | 81 | 30.34 | 21782 | 37302 |
| 23 | 0.00 | 29 | 24 | 26.0 | 0.43 | 86 | 30.45 | 13716 | 23746 |
| 24 | 12.70 | 28 | 22 | 25.1 | 0.85 | 61 | 29.65 | 13374 | 23758 |
| 25 | 0.00 | 32 | 21 | 26.4 | 0.91 | 198 | 29.14 | 25643 | 42255 |
| 26 | 0.00 | 35 | 24 | 28.8 | 2.16 | 178 | 29.48 | 25654 | 42799 |
| 27 | 1.02 | 33 | 23 | 28.5 | 1.79 | 229 | 28.11 | 20836 | 35269 |
| 28 | 30.48 | 26 | 21 | 22.5 | 1.66 | 71 | 23.55 | 8318 | 14605 |
| 29 | 1.52 | 29 | 22 | 24.9 | 1.24 | 166 | 27.79 | 19118 | 32060 |
| 30 | 0.00 | 34 | 24 | 28.4 | 3.53 | 188 | 28.17 | 23022 | 39447 |
| Mon. Tot. Precip. 156.7 mm | Mean wind vel. 1.514 m/s |
| Mon. Mean Temp. 23.2 deg. C | Wind dir 209 deg |
| Mean Max. Temp. 27.7 deg. C | Mean Min. Temp. 18.6 deg. C |
| Extreme Max. Temp 34.6 deg. C | Mean vapor press 22.87 mb |
| Extreme Min. Temp 11.4 deg. C | Total Solar Rad 597891 KJ/sq. m |
| Total photosyn. 1036595 uEin/sq.m |
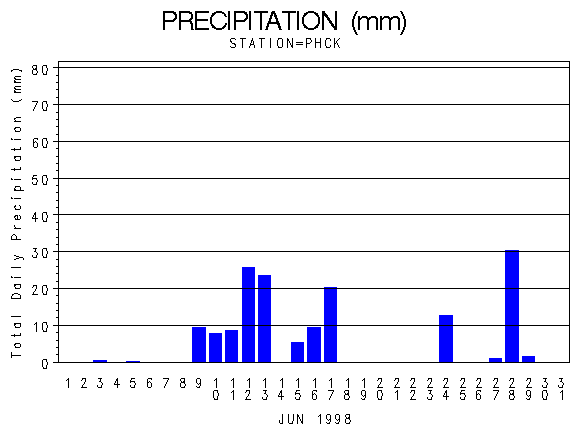 |
| Daily Total Precipitation (mm) |

 |
| Hourly Mean Temperatures (deg. C) |
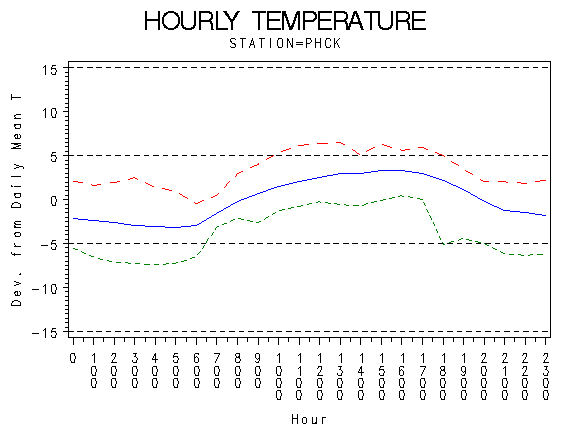 |
| Hourly Max Min and Mean Temperatures (deg. C) |
 |
| Wind Speed (m/s) |
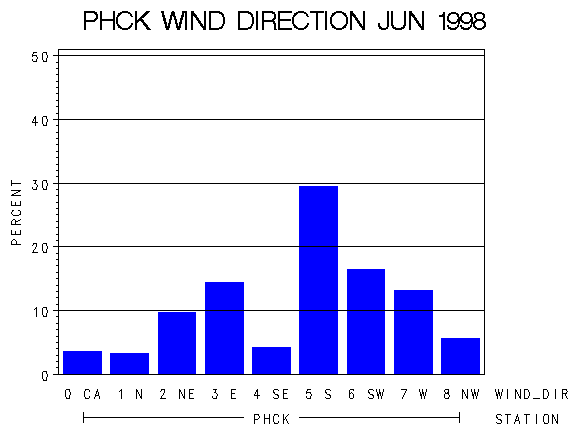 |
| Frequency of Wind Direction |
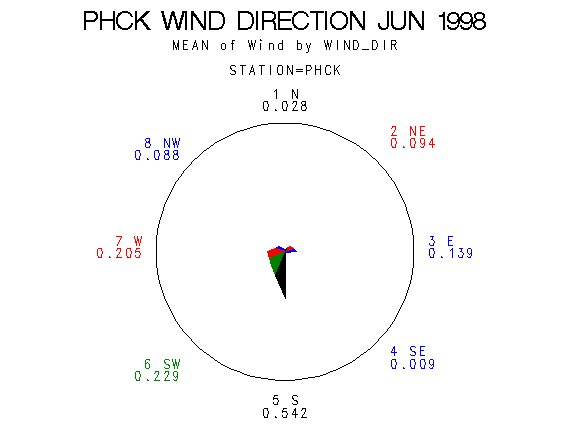 |
| Wind Vectors (circle=1.5 m/s) |
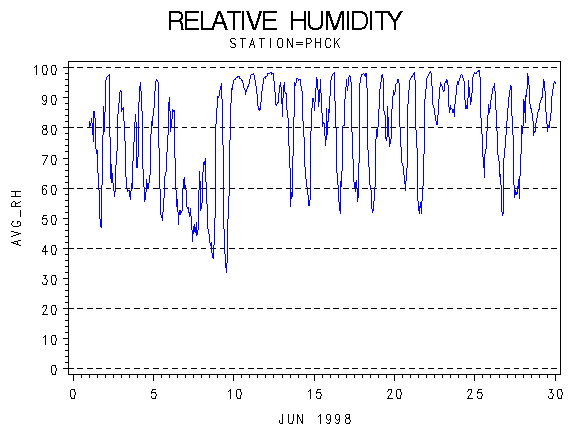 |
| Relative Humidity (percent) |
 |
| Photosynthetically Active Radiation (micro-einsteins per m squared) |
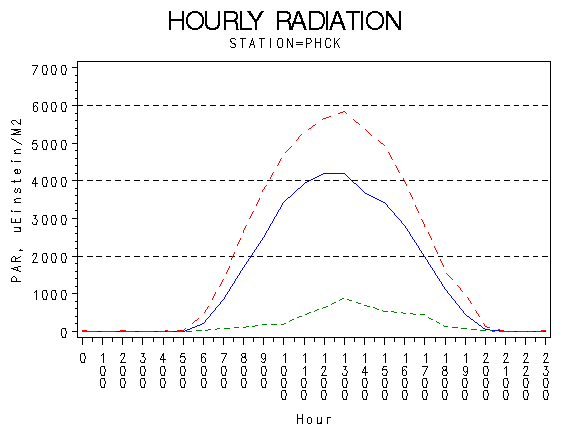 |
| Hourly Photosynthetically Active Radiation (micro-einsteins per m squared) |
 |
| Solar Radiation (KiloJoules per Meter Squared) |
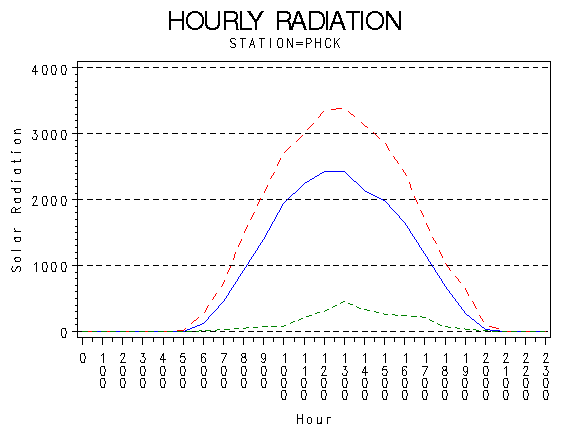 |
| Hourly Solar Radiation (KiloJoules per Meter Squared) |
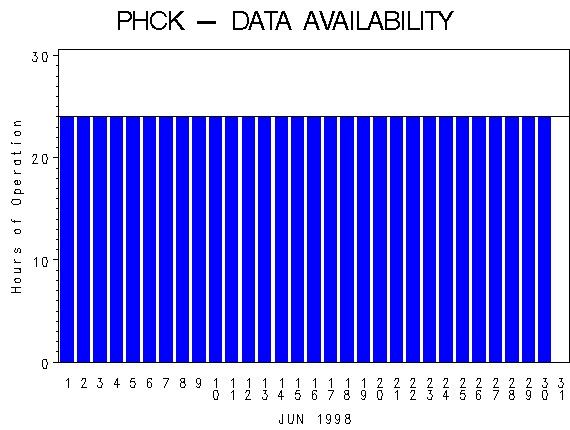 |
| Hours of Station Operation |
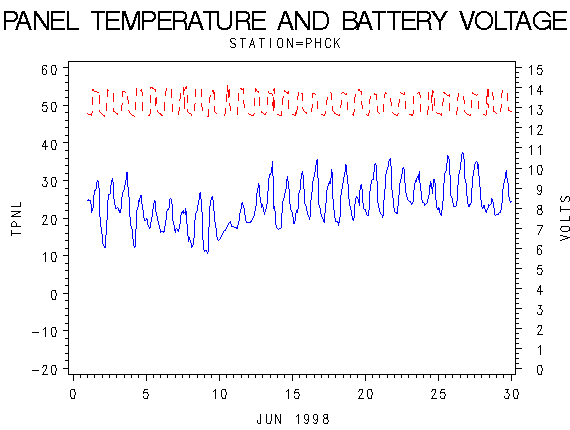 |
| Data Logger Battery Voltage and Internal Logger Temperature |