
|
| VIRGINIA COAST RESERVE LONG-TERM ECOLOGICAL RESEARCH |
Site PHCK, Month MAY, Year 1998 |

| 
|
| Day of Month | Precip (mm) | Max Temp. oC | Min Temp. oC | Mean Temp. oC | Wind Speed (m/s) | Wind Dir (deg.) | Vapor Press. (mb) | Solar Rad. KJ/m2 | PAR uE/m2 |
|---|---|---|---|---|---|---|---|---|---|
| 1 | 20.57 | 17 | 15 | 15.9 | 1.47 | 23 | 17.22 | 4232 | 8395 |
| 2 | 2.79 | 23 | 13 | 18.1 | 2.66 | 185 | 16.12 | 24495 | 43196 |
| 3 | 0.00 | 26 | 12 | 19.1 | 2.19 | 189 | 16.54 | 25070 | 44624 |
| 4 | 15.49 | 22 | 15 | 17.8 | 0.65 | 150 | 18.13 | 15329 | 27574 |
| 5 | 4.06 | 23 | 15 | 17.6 | 0.97 | 148 | 17.88 | 16598 | 30329 |
| 6 | 0.00 | 23 | 13 | 18.0 | 0.69 | 227 | 18.10 | 24431 | 44145 |
| 7 | 0.00 | 22 | 13 | 18.2 | 0.46 | 120 | 18.08 | 15691 | 29303 |
| 8 | 21.84 | 20 | 14 | 16.9 | 1.13 | 98 | 18.20 | 5683 | 11593 |
| 9 | 1.27 | 18 | 14 | 16.2 | 3.38 | 297 | 17.11 | 4935 | 10129 |
| 10 | 0.25 | 21 | 13 | 16.1 | 2.43 | 318 | 16.49 | 9762 | 18612 |
| 11 | 0.76 | 14 | 11 | 11.9 | 2.43 | 30 | 12.67 | 4394 | 8693 |
| 12 | 19.05 | 13 | 10 | 11.2 | 2.61 | 27 | 12.41 | 4782 | 9924 |
| 13 | 1.52 | 15 | 9 | 10.9 | 3.10 | 44 | 11.77 | 12649 | 22848 |
| 14 | 0.00 | 17 | 8 | 11.3 | 1.71 | 32 | 11.60 | 23776 | 41151 |
| 15 | 0.00 | 26 | 5 | 15.3 | 0.60 | 163 | 14.07 | 26942 | 48498 |
| 16 | 0.00 | 30 | 13 | 21.6 | 1.12 | 187 | 17.76 | 25334 | 45274 |
| 17 | 0.00 | 28 | 16 | 22.3 | 1.81 | 233 | 19.09 | 19484 | 33696 |
| 18 | 0.00 | 29 | 13 | 21.5 | 1.37 | 305 | 15.97 | 27171 | 45652 |
| 19 | 0.00 | 32 | 19 | 25.1 | 2.05 | 219 | 17.87 | 27130 | 45717 |
| 20 | 0.00 | 30 | 20 | 24.5 | 1.98 | 219 | 21.56 | 16113 | 28018 |
| 21 | 0.00 | 30 | 19 | 24.0 | 1.25 | 266 | 21.54 | 17448 | 30155 |
| 22 | 0.00 | 23 | 13 | 19.0 | 1.74 | 300 | 12.38 | 27447 | 46024 |
| 23 | 4.57 | 19 | 11 | 15.2 | 1.02 | 64 | 14.71 | 6574 | 12386 |
| 24 | 0.00 | 21 | 10 | 16.9 | 0.87 | 221 | 15.65 | 10329 | 19073 |
| 25 | 0.00 | 30 | 17 | 22.9 | 1.46 | 193 | 22.41 | 23972 | 42056 |
| 26 | 0.00 | 28 | 19 | 23.5 | 1.55 | 287 | 20.90 | 23448 | 40734 |
| 27 | 70.36 | 21 | 16 | 18.5 | 0.89 | 77 | 19.95 | 5257 | 10198 |
| 28 | 1.78 | 23 | 16 | 19.2 | 0.62 | 73 | 20.16 | 22418 | 38961 |
| 29 | 0.25 | 27 | 15 | 21.5 | 1.09 | 177 | 22.06 | 24011 | 42721 |
| 30 | 0.00 | 31 | 20 | 25.4 | 1.59 | 199 | 26.49 | 25338 | 44944 |
| 31 | 0.00 | 30 | 22 | 25.3 | 2.38 | 180 | 25.01 | 24080 | 42509 |
| Mon. Tot. Precip. 164.6 mm | Mean wind vel. 1.589 m/s |
| Mon. Mean Temp. 18.7 deg. C | Wind dir 211 deg |
| Mean Max. Temp. 23.6 deg. C | Mean Min. Temp. 14.2 deg. C |
| Extreme Max. Temp 32.2 deg. C | Mean vapor press 17.74 mb |
| Extreme Min. Temp 5.1 deg. C | Total Solar Rad 544322 KJ/sq. m |
| Total photosyn. 967134 uEin/sq.m |
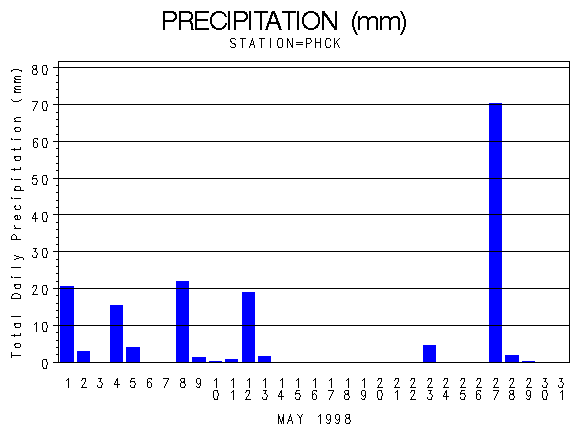 |
| Daily Total Precipitation (mm) |

 |
| Hourly Mean Temperatures (deg. C) |
 |
| Hourly Max Min and Mean Temperatures (deg. C) |
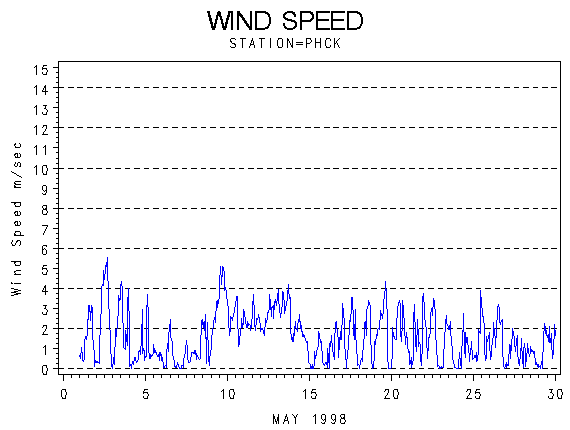 |
| Wind Speed (m/s) |
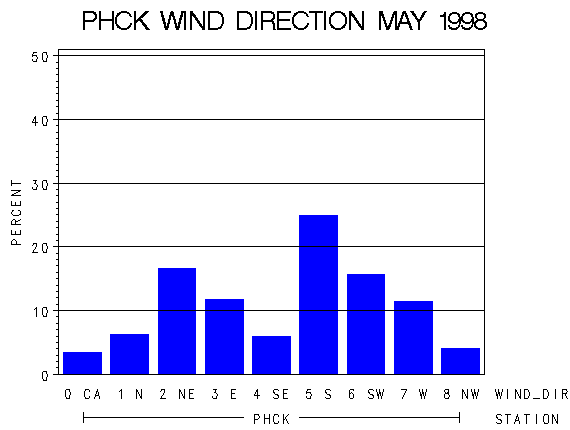 |
| Frequency of Wind Direction |
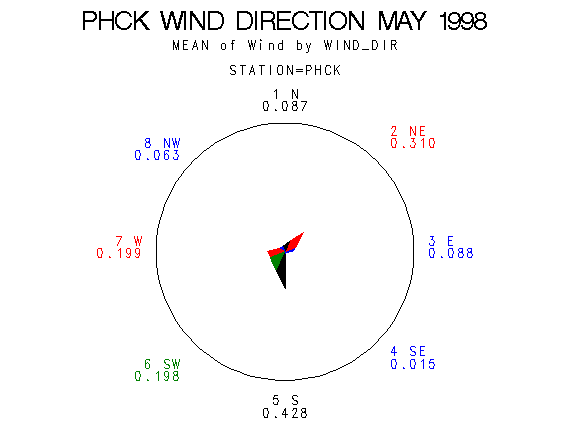 |
| Wind Vectors (circle=1.5 m/s) |
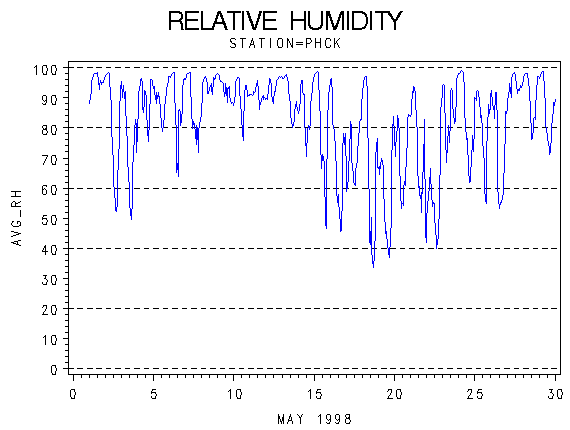 |
| Relative Humidity (percent) |
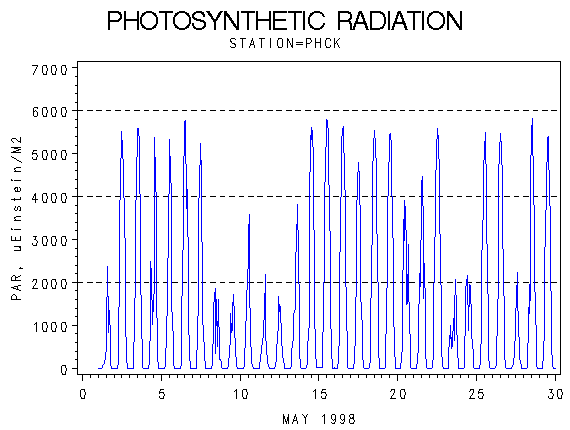 |
| Photosynthetically Active Radiation (micro-einsteins per m squared) |
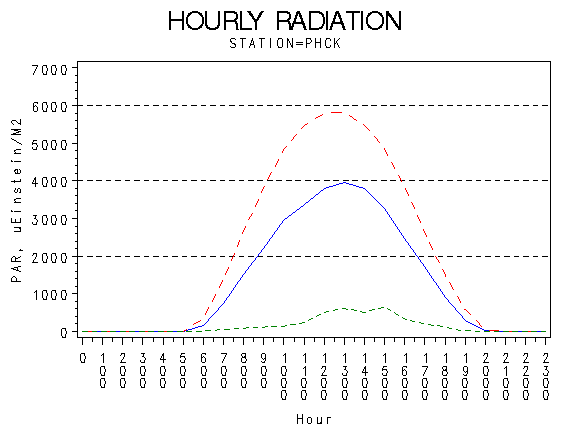 |
| Hourly Photosynthetically Active Radiation (micro-einsteins per m squared) |
 |
| Solar Radiation (KiloJoules per Meter Squared) |
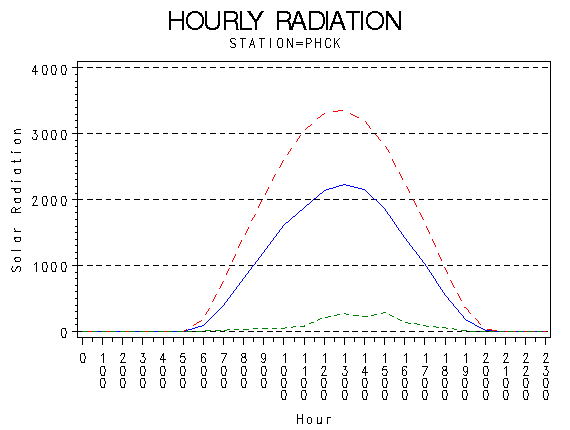 |
| Hourly Solar Radiation (KiloJoules per Meter Squared) |
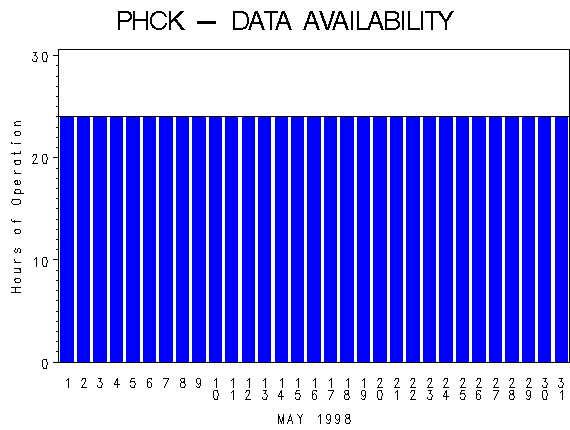 |
| Hours of Station Operation |
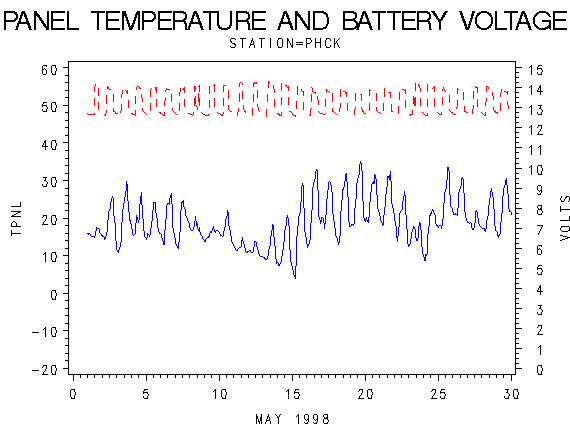 |
| Data Logger Battery Voltage and Internal Logger Temperature |