

| VIRGINIA COAST RESERVE LONG-TERM ECOLOGICAL RESEARCH |
Site PHCK, Month AUG, Year 1997 |

| 
|
| Day of Month | Precip (mm) | Max Temp. oC | Min Temp. oC | Mean Temp. oC | Wind Speed (m/s) | Wind Dir (deg.) | Vapor Press. (mb) | Solar Rad. KJ/m2 | PAR uE/m2 |
|---|---|---|---|---|---|---|---|---|---|
| 1 | 0.00 | 30 | 14 | 22.6 | 0.60 | 186 | 18.15 | 26773 | 46955 |
| 2 | 0.00 | 31 | 16 | 24.0 | 1.65 | 188 | 21.82 | 22355 | 40329 |
| 3 | 5.08 | 31 | 20 | 26.3 | 1.43 | 218 | 23.67 | 24376 | 44475 |
| 4 | 0.00 | 31 | 20 | 24.3 | 0.71 | 6 | 26.74 | 16440 | 30317 |
| 5 | 19.81 | 27 | 19 | 22.8 | 1.29 | 324 | 22.57 | 17516 | 31087 |
| 6 | 12.19 | 26 | 17 | 21.3 | 1.02 | 51 | 20.28 | 17716 | 31824 |
| 7 | 0.25 | 27 | 17 | 21.3 | 0.58 | 75 | 18.70 | 18540 | 32654 |
| 8 | 0.00 | 29 | 15 | 22.3 | 0.94 | 239 | 19.31 | 24566 | 42959 |
| 9 | 0.51 | 29 | 16 | 23.4 | 1.14 | 195 | 19.34 | 23993 | 42889 |
| 10 | 0.00 | 29 | 17 | 23.3 | 0.34 | 159 | 21.74 | 15926 | 29562 |
| 11 | 0.00 | 28 | 18 | 23.4 | 0.35 | 103 | 23.47 | 23590 | 42196 |
| 12 | 0.00 | 32 | 21 | 26.3 | 0.73 | 191 | 26.69 | 19974 | 36845 |
| 13 | 0.00 | 34 | 24 | 28.4 | 2.28 | 181 | 28.54 | 20431 | 38417 |
| 14 | 0.00 | 30 | 23 | 26.9 | 1.93 | 212 | 29.68 | 12364 | 23636 |
| 15 | 0.00 | 31 | 22 | 26.6 | 0.68 | 91 | 30.64 | 19404 | 34923 |
| 16 | 0.00 | 35 | 26 | 29.9 | 2.22 | 191 | 31.74 | 23023 | 42656 |
| 17 | 0.00 | 35 | 26 | 30.6 | 3.38 | 187 | 31.62 | 22863 | 42624 |
| 18 | 0.00 | 31 | 20 | 26.2 | 2.51 | 286 | 27.24 | 11596 | 22945 |
| 19 | 0.00 | 27 | 16 | 21.6 | 0.94 | 358 | 18.35 | 19664 | 36492 |
| 20 | 0.00 | 26 | 19 | 23.3 | 0.98 | 174 | 24.76 | 4183 | 8462 |
| 21 | 0.00 | 28 | 22 | 24.7 | 1.71 | 255 | 25.05 | 17939 | 32801 |
| 22 | 0.00 | 28 | 18 | 23.7 | 1.22 | 294 | 21.05 | 22461 | 40588 |
| 23 | 0.00 | 26 | 14 | 20.1 | 1.06 | 248 | 16.51 | 21115 | 39054 |
| 24 | 0.00 | 26 | 14 | 20.5 | 0.51 | 89 | 16.69 | 23644 | 42054 |
| 25 | 0.00 | 26 | 14 | 20.5 | 0.76 | 75 | 17.41 | 22674 | 40600 |
| 26 | 0.00 | 26 | 14 | 20.6 | 0.72 | 74 | 18.76 | 22849 | 40845 |
| 27 | 0.00 | 26 | 15 | 21.5 | 0.46 | 89 | 20.48 | 22741 | 40548 |
| 28 | 0.00 | 29 | 15 | 22.4 | 0.47 | 176 | 22.27 | 19302 | 33735 |
| 29 | 0.00 | 28 | 17 | 22.9 | 1.60 | 326 | 21.05 | 20876 | 36854 |
| 30 | 0.00 | 28 | 16 | 21.8 | 0.96 | 322 | 18.23 | 22434 | 40754 |
| 31 | 0.00 | 29 | 16 | 22.7 | 0.29 | 120 | 22.09 | 20209 | 36003 |
| Mon. Tot. Precip. 37.8 mm | Mean wind vel. 1.143 m/s |
| Mon. Mean Temp. 23.7 deg. C | Wind dir 197 deg |
| Mean Max. Temp. 29.0 deg. C | Mean Min. Temp. 18.1 deg. C |
| Extreme Max. Temp 35.2 deg. C | Mean vapor press 22.73 mb |
| Extreme Min. Temp 13.6 deg. C | Total Solar Rad 621536 KJ/sq. m |
| Total photosyn. 1126082 uEin/sq.m |
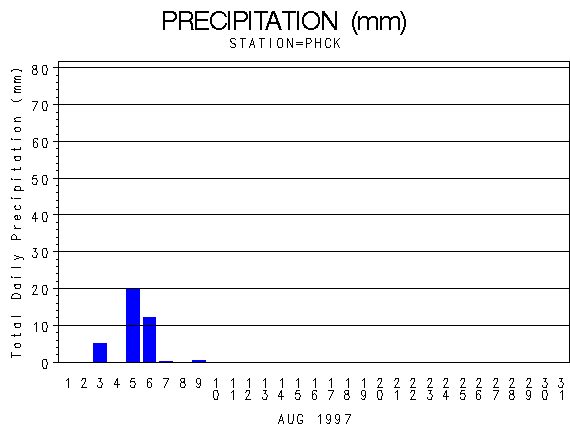 |
| Daily Total Precipitation (mm) |

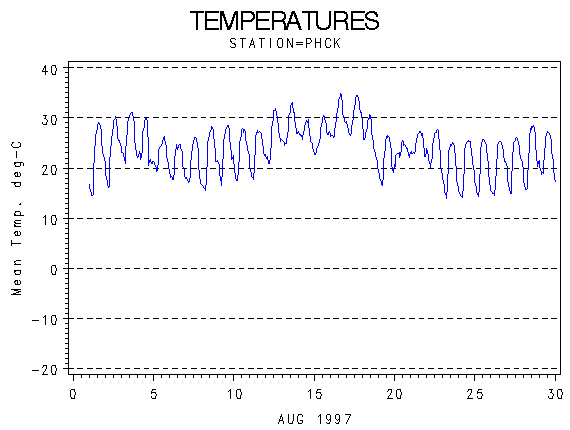 |
| Hourly Mean Temperatures (deg. C) |

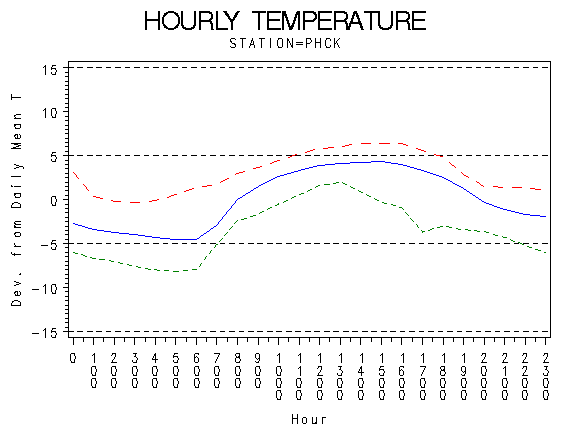 |
| Hourly Max Min and Mean Temperatures (deg. C) |

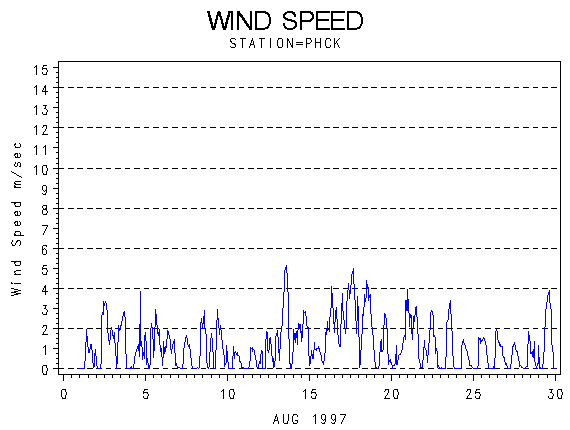 |
| Wind Speed (m/s) |

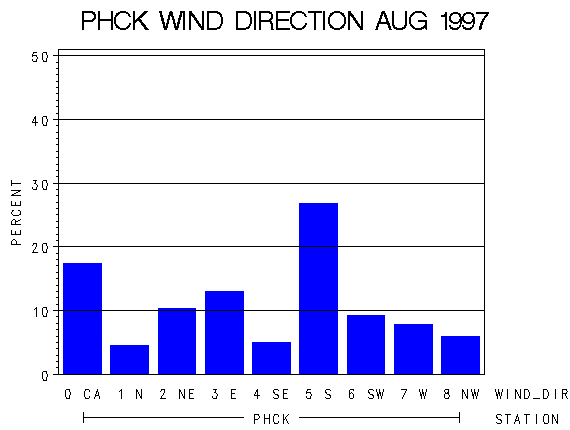 |
| Frequency of Wind Direction |

 |
| Wind Vectors (circle=1.5 m/s) |

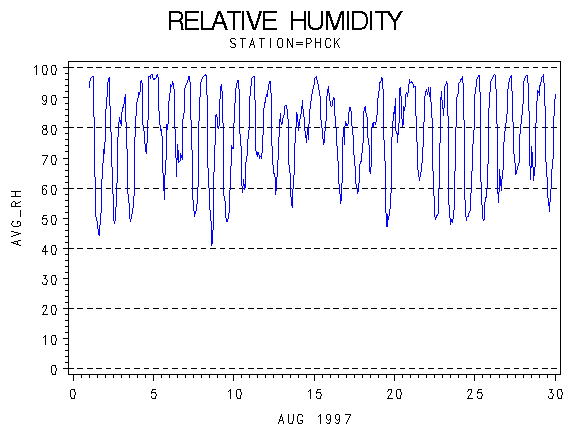 |
| Relative Humidity (percent) |

 |
| Photosynthetically Active Radiation (micro-einsteins per m squared) |

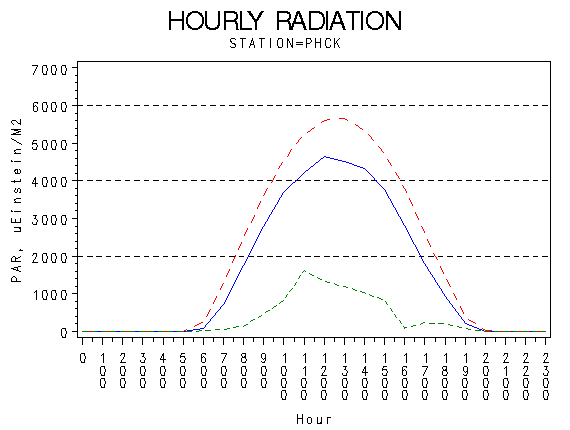 |
| Hourly Photosynthetically Active Radiation (micro-einsteins per m squared) |

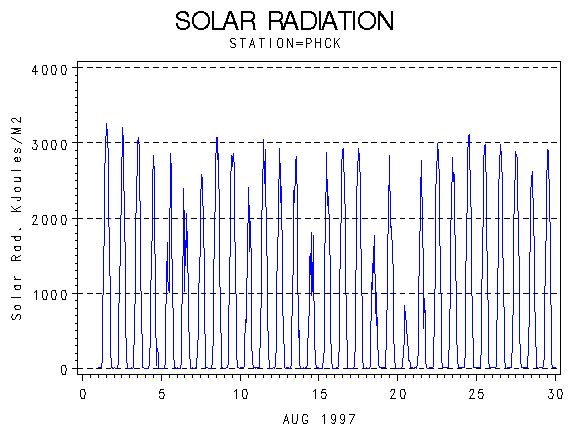 |
| Solar Radiation (KiloJoules per Meter Squared) |

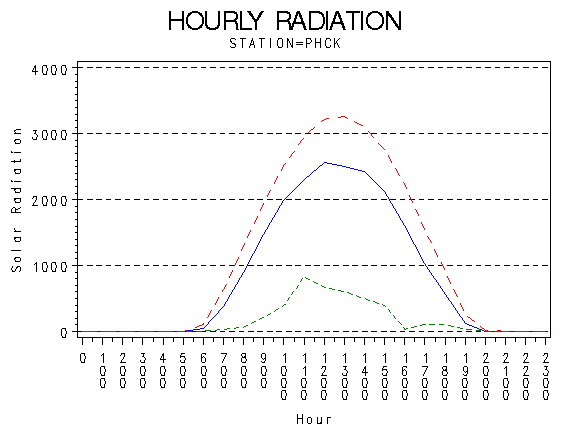 |
| Hourly Solar Radiation (KiloJoules per Meter Squared) |

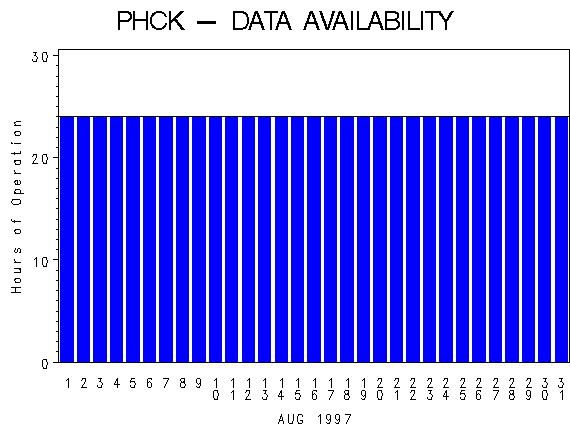 |
| Hours of Station Operation |

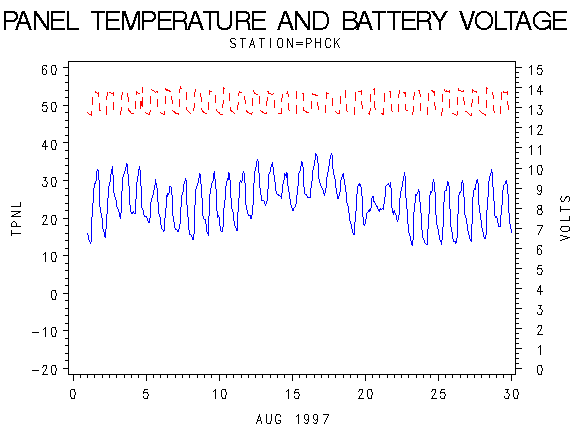 |
| Data Logger Battery Voltage and Internal Logger Temperature |
