
|
| VIRGINIA COAST RESERVE LONG-TERM ECOLOGICAL RESEARCH |
Site PHCK, Month JUN, Year 1997 |

| 
|
| Day of Month | Precip (mm) | Max Temp. oC | Min Temp. oC | Mean Temp. oC | Wind Speed (m/s) | Wind Dir (deg.) | Vapor Press. (mb) | Solar Rad. KJ/m2 | PAR uE/m2 |
|---|---|---|---|---|---|---|---|---|---|
| 1 | 0.00 | 24 | 17 | 19.2 | 1.46 | 71 | 21.16 | 13145 | 25982 |
| 2 | 0.00 | 18 | 15 | 16.9 | 2.66 | 67 | 18.71 | 5136 | 10932 |
| 3 | 0.00 | 15 | 12 | 13.7 | 4.66 | 65 | 14.93 | 3762 | 8330 |
| 4 | 0.00 | 18 | 10 | 13.6 | 3.38 | 51 | 12.36 | 18289 | 35561 |
| 5 | 0.00 | 19 | 8 | 13.7 | 1.22 | 69 | 11.35 | 28268 | 52842 |
| 6 | 0.00 | 16 | 12 | 13.9 | 2.96 | 72 | 13.26 | 14643 | 28831 |
| 7 | 0.00 | 15 | 12 | 13.0 | 3.93 | 63 | 12.79 | 6273 | 12977 |
| 8 | 0.00 | 18 | 9 | 13.5 | 1.89 | 62 | 12.57 | 23542 | 44405 |
| 9 | 0.00 | 22 | 8 | 15.0 | 1.10 | 104 | 12.48 | 27336 | 50053 |
| 10 | 0.00 | 29 | 11 | 21.0 | 1.44 | 258 | 12.60 | 28489 | 51532 |
| 11 | 0.00 | 29 | 16 | 22.8 | 2.36 | 208 | 15.17 | 23888 | 43824 |
| 12 | 0.00 | 27 | 17 | 22.9 | 2.22 | 176 | 20.56 | 21154 | 39541 |
| 13 | 0.00 | 29 | 21 | 23.9 | 3.50 | 174 | 23.50 | 17882 | 34050 |
| 14 | 0.00 | 27 | 19 | 22.3 | 1.44 | 279 | 23.65 | 13341 | 26322 |
| 15 | 0.00 | 23 | 16 | 19.0 | 2.58 | 66 | 16.13 | 26183 | 48145 |
| 16 | 0.00 | 23 | 11 | 18.2 | 0.87 | 82 | 15.99 | 28064 | 50689 |
| 17 | 0.00 | 30 | 15 | 22.7 | 1.33 | 167 | 22.31 | 23107 | 43796 |
| 18 | 0.00 | 33 | 22 | 26.3 | 2.23 | 170 | 27.28 | 21573 | 41293 |
| 19 | 0.00 | 29 | 19 | 25.6 | 2.47 | 261 | 24.68 | 24017 | 45182 |
| 20 | 0.00 | 31 | 18 | 24.7 | 0.69 | 169 | 22.24 | 26660 | 48556 |
| 21 | 0.00 | 30 | 20 | 25.6 | 1.87 | 170 | 26.70 | 25307 | 46874 |
| 22 | 0.00 | 34 | 23 | 28.1 | 2.77 | 185 | 26.28 | 25867 | 47869 |
| 23 | 0.00 | 31 | 21 | 26.8 | 0.99 | 79 | 20.82 | 25741 | 46817 |
| 24 | 0.00 | 34 | 20 | 26.9 | 2.26 | 203 | 20.05 | 26885 | 49395 |
| 25 | 0.00 | 36 | 23 | 28.6 | 2.81 | 192 | 26.77 | 25848 | 47624 |
| 26 | 0.00 | 36 | 22 | 28.9 | 2.85 | 212 | 27.11 | 24432 | 45706 |
| 27 | 0.00 | 29 | 18 | 24.3 | 1.39 | 50 | 22.38 | 25030 | 45540 |
| 28 | 0.00 | 28 | 17 | 22.8 | 0.58 | 101 | 20.59 | 28012 | 50245 |
| 29 | 0.00 | 28 | 15 | 22.2 | 0.45 | 114 | 17.86 | 26539 | 47764 |
| 30 | 0.00 | 28 | 22 | 24.4 | 0.52 | 112 | 23.30 | 19374 | 36969 |
| Mon. Tot. Precip. 0.0 mm | Mean wind vel. 2.029 m/s |
| Mon. Mean Temp. 21.4 deg. C | Wind dir 121 deg |
| Mean Max. Temp. 26.3 deg. C | Mean Min. Temp. 16.3 deg. C |
| Extreme Max. Temp 36.0 deg. C | Mean vapor press 19.52 mb |
| Extreme Min. Temp 7.9 deg. C | Total Solar Rad 647785 KJ/sq. m |
| Total photosyn. 1207646 uEin/sq.m |
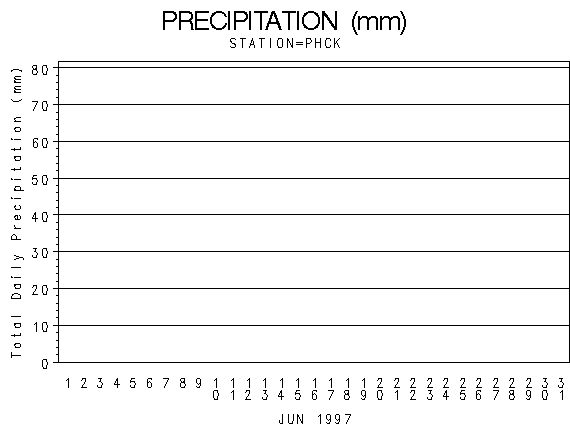 |
| Daily Total Precipitation (mm) |

 |
| Hourly Mean Temperatures (deg. C) |
 |
| Hourly Max Min and Mean Temperatures (deg. C) |
 |
| Wind Speed (m/s) |
 |
| Frequency of Wind Direction |
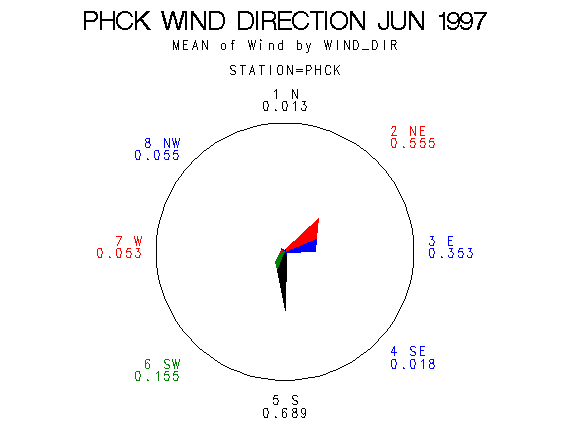 |
| Wind Vectors (circle=1.5 m/s) |
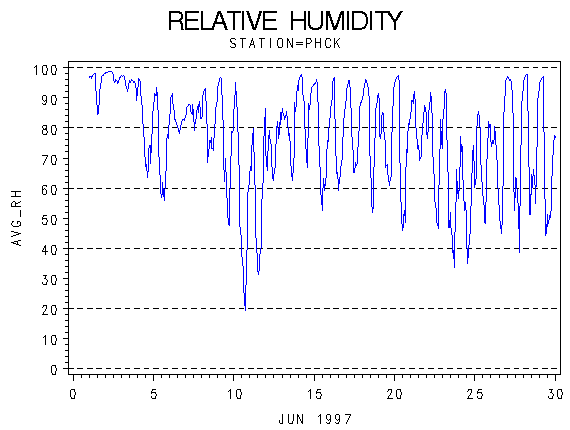 |
| Relative Humidity (percent) |
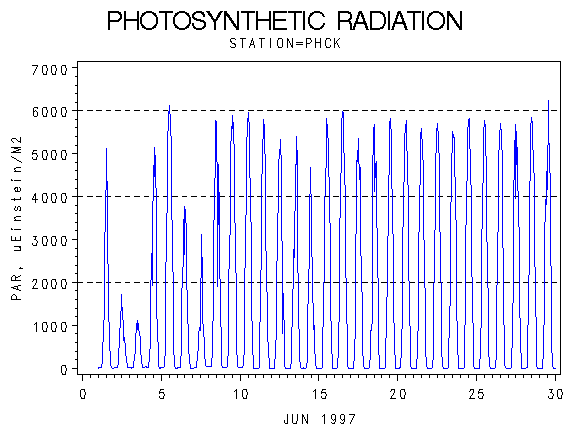 |
| Photosynthetically Active Radiation (micro-einsteins per m squared) |
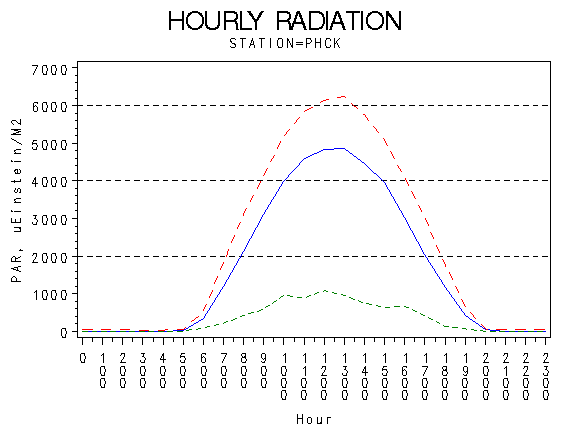 |
| Hourly Photosynthetically Active Radiation (micro-einsteins per m squared) |
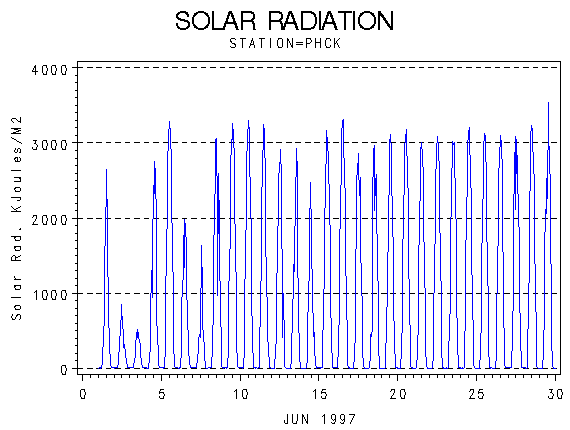 |
| Solar Radiation (KiloJoules per Meter Squared) |
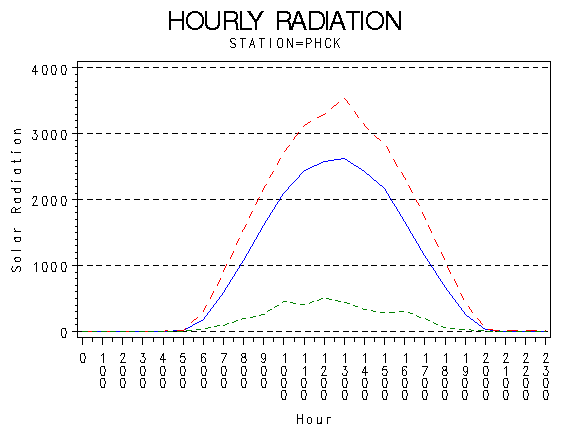 |
| Hourly Solar Radiation (KiloJoules per Meter Squared) |
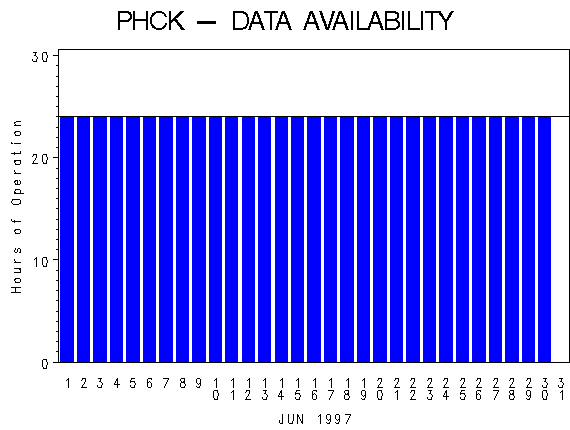 |
| Hours of Station Operation |
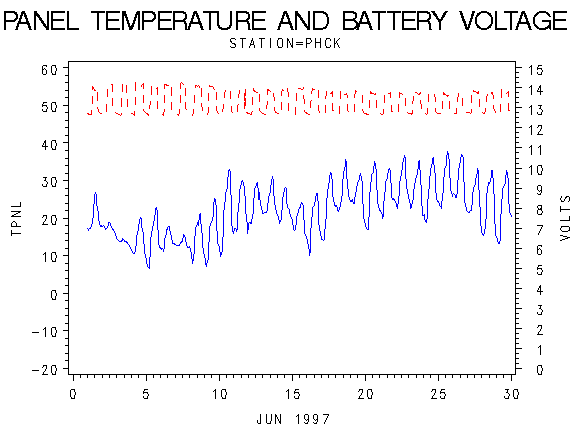 |
| Data Logger Battery Voltage and Internal Logger Temperature |