

| VIRGINIA COAST RESERVE LONG-TERM ECOLOGICAL RESEARCH |
Site PHCK, Month SEP, Year 1995 |

| 
|
| Day of Month | Precip (mm) | Max Temp. oC | Min Temp. oC | Mean Temp. oC | Wind Speed (m/s) | Wind Dir (deg.) | Vapor Press. (mb) | Solar Rad. KJ/m2 | PAR uE/m2 |
|---|---|---|---|---|---|---|---|---|---|
| 1 | 28.00 | 32 | 21 | 25.9 | 2.63 | 256 | 26.44 | 7368 | 36320 |
| 2 | 1.40 | 26 | 18 | 21.5 | 1.28 | 354 | 20.15 | 6009 | 34544 |
| 3 | 0.30 | 26 | 16 | 20.7 | 0.87 | 53 | 18.70 | 7443 | 31484 |
| 4 | 0.00 | 27 | 14 | 20.6 | 0.49 | 122 | 17.47 | 9312 | 44501 |
| 5 | 0.00 | 28 | 14 | 21.4 | 0.53 | 47 | 17.30 | 7773 | 41908 |
| 6 | 0.00 | 30 | 15 | 22.1 | 0.74 | 274 | 18.81 | 4784 | 38220 |
| 7 | 0.50 | 27 | 17 | 22.6 | 0.36 | 85 | 22.94 | 3608 | 23322 |
| 8 | 0.00 | 27 | 21 | 23.6 | 1.30 | 60 | 25.26 | 2210 | 30562 |
| 9 | 0.80 | 27 | 20 | 23.7 | 1.49 | 54 | 25.37 | 2326 | 29621 |
| 10 | 0.30 | 25 | 14 | 21.1 | 1.80 | 2 | 17.61 | 2129 | 37916 |
| 11 | 0.00 | 24 | 14 | 18.9 | 1.85 | 51 | 13.49 | 415 | 44097 |
| 12 | 0.00 | 25 | 11 | 19.0 | 0.62 | 58 | 16.31 | 432 | 40329 |
| 13 | 0.00 | 29 | 18 | 24.3 | 1.80 | 224 | 23.32 | 441 | 40348 |
| 14 | 0.00 | 31 | 22 | 25.9 | 2.09 | 247 | 25.44 | 409 | 34555 |
| 15 | 0.30 | 26 | 21 | 23.1 | 2.69 | 51 | 18.08 | 581 | 41230 |
| 16 | 3.10 | 24 | 21 | 22.1 | 2.40 | 68 | 19.74 | 451 | 17228 |
| 17 | 29.20 | 23 | 19 | 21.6 | 2.32 | 271 | 23.51 | 625 | 7588 |
| 18 | 0.00 | 25 | 15 | 20.3 | 1.48 | 43 | 19.67 | 543 | 30081 |
| 19 | 0.00 | 24 | 17 | 20.9 | 2.76 | 50 | 19.12 | 468 | 40276 |
| 20 | 0.00 | 25 | 15 | 19.8 | 1.00 | 55 | 17.34 | 552 | 37991 |
| 21 | 0.00 | 27 | 16 | 21.2 | 0.59 | 235 | 19.94 | 390 | 23899 |
| 22 | 54.50 | 27 | 16 | 23.0 | 1.98 | 259 | 24.81 | 542 | 21699 |
| 23 | 2.30 | 17 | 11 | 13.8 | 2.65 | 17 | 11.48 | 430 | 10930 |
| 24 | 0.00 | 21 | 12 | 17.3 | 2.28 | 39 | 14.59 | 445 | 26000 |
| 25 | 0.00 | 24 | 17 | 20.4 | 1.35 | 56 | 20.07 | 440 | 33855 |
| 26 | 0.00 | 21 | 16 | 18.7 | 1.12 | 308 | 19.41 | 422 | 11062 |
| 27 | 0.00 | 24 | 12 | 17.2 | 0.75 | 340 | 15.30 | 432 | 33066 |
| 28 | 0.00 | 24 | 11 | 18.3 | 1.48 | 39 | 15.59 | 508 | 36131 |
| 29 | 0.00 | 23 | 15 | 19.3 | 3.08 | 48 | 17.60 | 466 | 31163 |
| 30 | 0.00 | 23 | 14 | 18.0 | 2.30 | 43 | 16.83 | 420 | 37244 |
| Mon. Tot. Precip. 120.7 mm | Mean wind vel. 1.603 m/s |
| Mon. Mean Temp. 20.9 deg. C | Wind dir 30 deg |
| Mean Max. Temp. 25.4 deg. C | Mean Min. Temp. 16.1 deg. C |
| Extreme Max. Temp 31.7 deg. C | Mean vapor press 19.39 mb |
| Extreme Min. Temp 10.7 deg. C | Total Solar Rad 62372 KJ/sq. m |
| Total photosyn. 947172 uEin/sq.m |
 |
| Daily Total Precipitation (mm) |

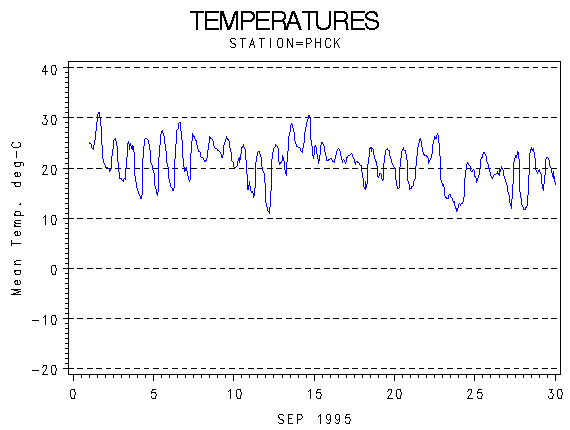 |
| Hourly Mean Temperatures (deg. C) |

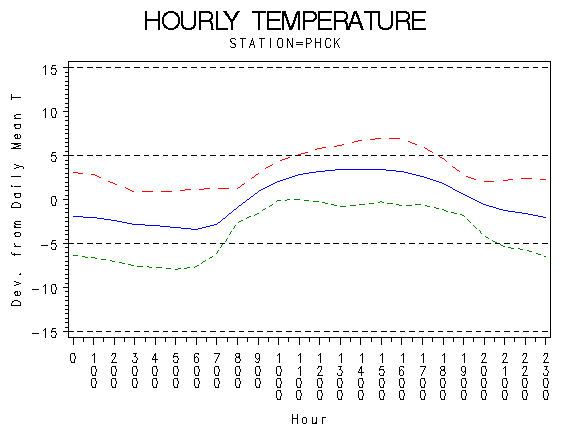 |
| Hourly Max Min and Mean Temperatures (deg. C) |

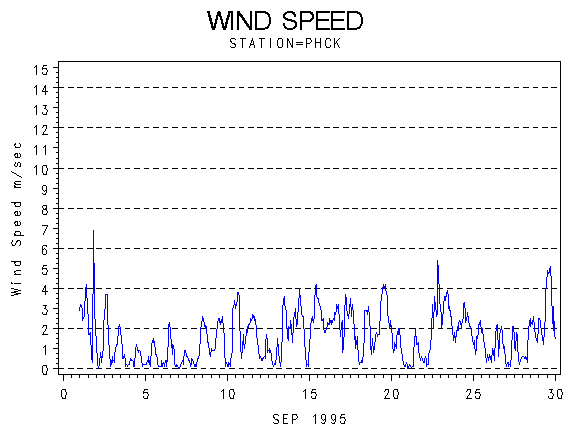 |
| Wind Speed (m/s) |

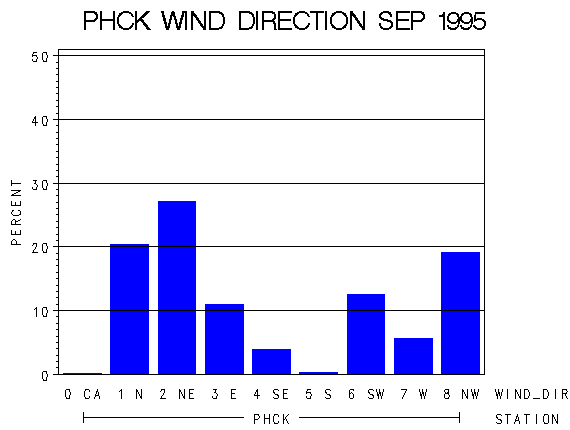 |
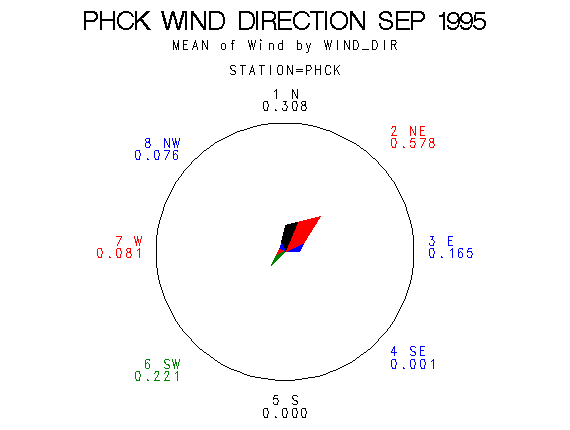
| Frequency of Wind Direction |

 |
| Wind Vectors (circle=1.5 m/s) |

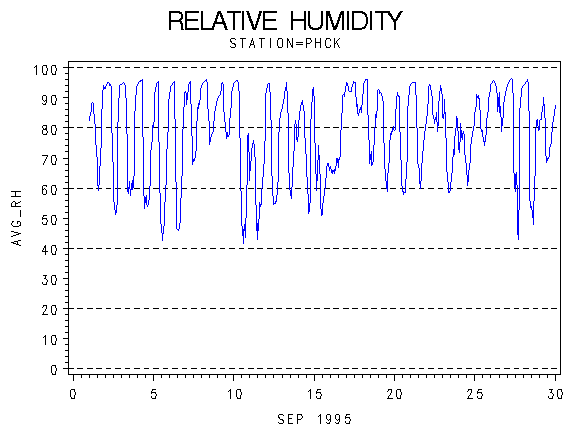 |
| Relative Humidity (percent) |

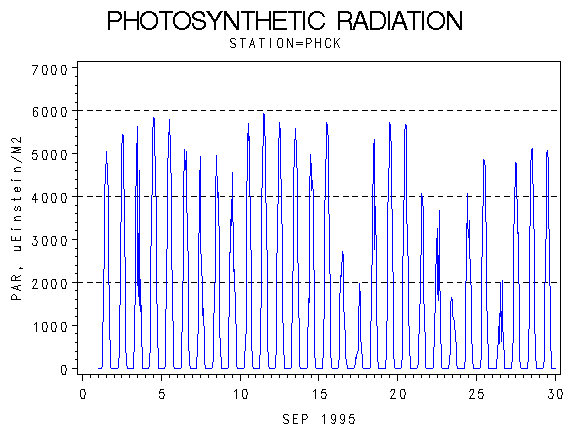 |
| Photosynthetically Active Radiation (micro-einsteins per m squared) |

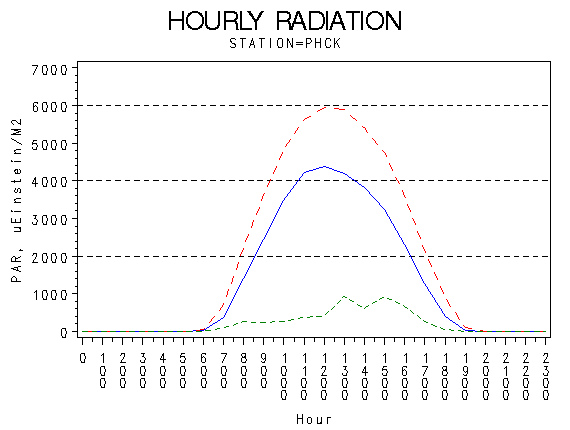 |
| Hourly Photosynthetically Active Radiation (micro-einsteins per m squared) |

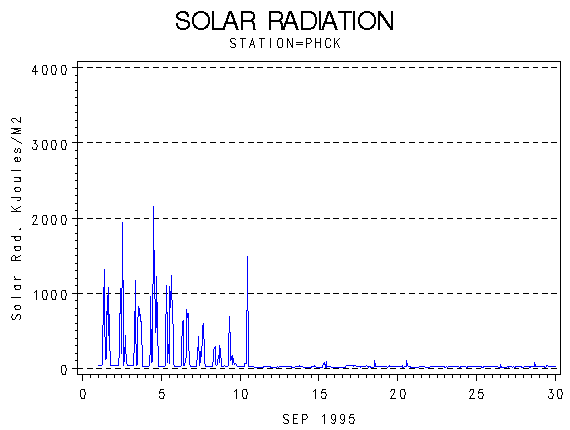 |
| Solar Radiation (KiloJoules per Meter Squared) |

 |
| Hourly Solar Radiation (KiloJoules per Meter Squared) |

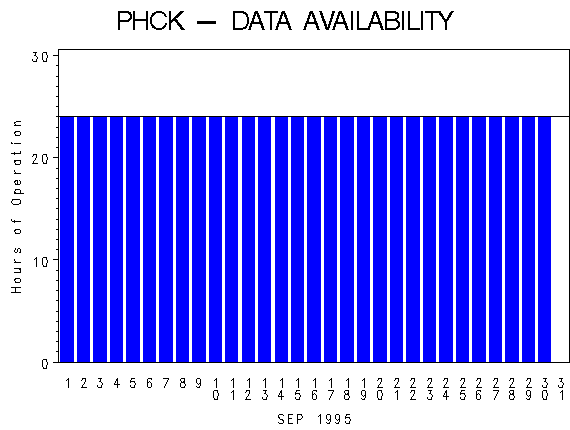 |
| Hours of Station Operation |

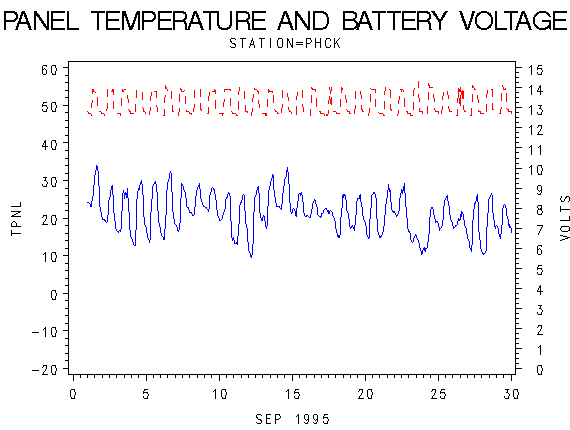 |
| Data Logger Battery Voltage and Internal Logger Temperature |
