
|
| VIRGINIA COAST RESERVE LONG-TERM ECOLOGICAL RESEARCH |
Site PHCK, Month JUN, Year 1995 |

| 
|
| Day of Month | Precip (mm) | Max Temp. oC | Min Temp. oC | Mean Temp. oC | Wind Speed (m/s) | Wind Dir (deg.) | Vapor Press. (mb) | Solar Rad. KJ/m2 | PAR uE/m2 |
|---|---|---|---|---|---|---|---|---|---|
| 1 | 0.00 | 26 | 11 | 20.1 | 0.58 | 125 | 18.74 | 24744 | 44163 |
| 2 | 0.00 | 28 | 19 | 23.9 | 0.78 | 170 | 24.77 | 23265 | 42943 |
| 3 | 1.90 | 28 | 20 | 23.8 | 2.16 | 229 | 24.37 | 16021 | 29185 |
| 4 | 0.00 | 29 | 21 | 24.1 | 2.30 | 327 | 21.04 | 27812 | 49095 |
| 5 | 0.00 | 24 | 16 | 20.8 | 1.23 | 68 | 20.52 | 19827 | 35755 |
| 6 | 22.40 | 23 | 21 | 21.5 | 2.64 | 53 | 23.92 | 6729 | 13083 |
| 7 | 0.60 | 30 | 21 | 24.4 | 3.33 | 295 | 23.63 | 23716 | 41256 |
| 8 | 0.00 | 33 | 22 | 26.9 | 1.87 | 301 | 24.55 | 26116 | 45764 |
| 9 | 0.00 | 23 | 19 | 20.9 | 2.24 | 63 | 20.96 | 19302 | 34219 |
| 10 | 0.00 | 24 | 19 | 20.9 | 0.72 | 90 | 19.60 | 19238 | 34184 |
| 11 | 0.00 | 32 | 21 | 25.6 | 2.53 | 226 | 26.07 | 22738 | 40647 |
| 12 | 22.10 | 27 | 17 | 22.6 | 3.18 | 248 | 23.82 | 9785 | 18492 |
| 13 | 8.30 | 20 | 15 | 16.9 | 2.10 | 8 | 17.39 | 6526 | 12461 |
| 14 | 0.00 | 26 | 14 | 19.5 | 1.30 | 333 | 16.69 | 22773 | 36614 |
| 15 | 0.00 | 26 | 15 | 20.7 | 1.88 | 341 | 15.76 | 28797 | 45399 |
| 16 | 0.00 | 24 | 11 | 19.8 | 1.29 | 62 | 13.44 | 29069 | 45929 |
| 17 | 0.00 | 25 | 12 | 20.0 | 1.45 | 59 | 18.68 | 29079 | 47039 |
| 18 | 0.00 | 26 | 16 | 20.9 | 0.63 | 80 | 19.57 | 27823 | 45507 |
| 19 | 0.00 | 27 | 15 | 21.9 | 0.81 | 69 | 21.83 | 25701 | 43666 |
| 20 | 0.00 | 31 | 20 | 25.4 | 1.63 | 238 | 24.79 | 24820 | 42161 |
| 21 | 0.00 | 30 | 22 | 24.8 | 1.79 | 245 | 23.37 | 18812 | 31972 |
| 22 | 0.00 | 26 | 21 | 23.3 | 2.19 | 59 | 24.59 | 17851 | 31190 |
| 23 | 0.00 | 26 | 22 | 23.7 | 1.61 | 70 | 25.65 | 23726 | 40139 |
| 24 | 0.00 | 27 | 22 | 23.6 | 1.18 | 69 | 25.75 | 19722 | 33624 |
| 25 | 0.00 | 28 | 22 | 24.7 | 0.75 | 103 | 26.82 | 23280 | 39130 |
| 26 | 0.00 | 29 | 19 | 24.8 | 1.03 | 78 | 26.20 | 24176 | 41063 |
| 27 | 0.00 | 26 | 23 | 24.3 | 3.05 | 67 | 26.59 | 19305 | 33813 |
| 28 | 0.00 | 24 | 20 | 22.1 | 3.58 | 63 | 22.58 | 17496 | 30657 |
| 29 | 0.00 | 24 | 20 | 22.1 | 1.59 | 66 | 22.25 | 16254 | 28315 |
| 30 | 0.00 | 27 | 19 | 23.1 | 0.44 | 109 | 22.83 | 19326 | 33122 |
| Mon. Tot. Precip. 55.3 mm | Mean wind vel. 1.728 m/s |
| Mon. Mean Temp. 22.6 deg. C | Wind dir 36 deg |
| Mean Max. Temp. 26.6 deg. C | Mean Min. Temp. 18.5 deg. C |
| Extreme Max. Temp 32.7 deg. C | Mean vapor press 22.22 mb |
| Extreme Min. Temp 11.4 deg. C | Total Solar Rad 633830 KJ/sq. m |
| Total photosyn. 1090585 uEin/sq.m |
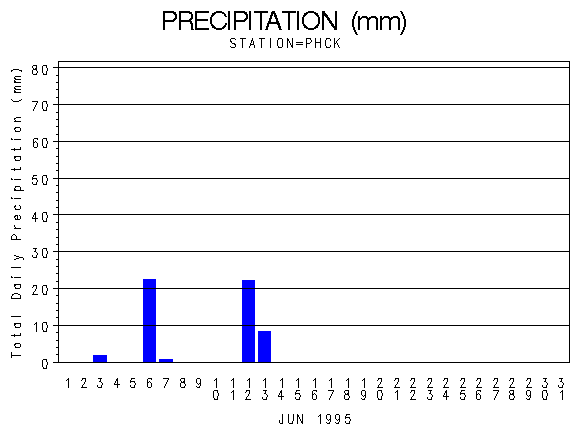 |
| Daily Total Precipitation (mm) |

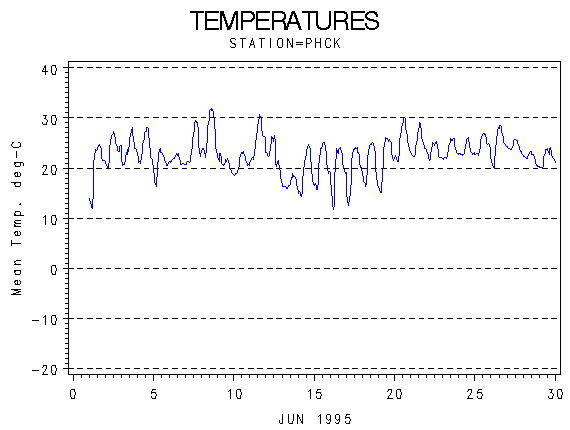 |
| Hourly Mean Temperatures (deg. C) |
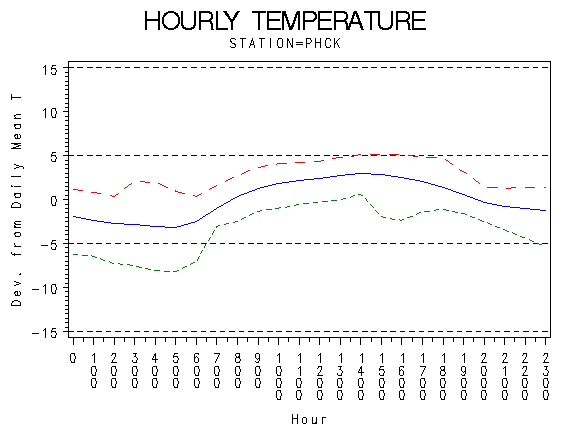 |
| Hourly Max Min and Mean Temperatures (deg. C) |
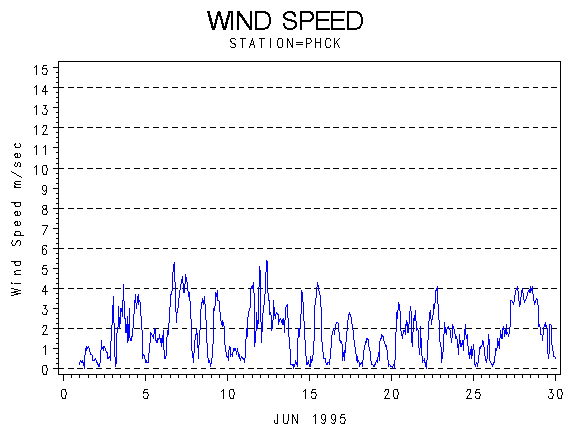 |
| Wind Speed (m/s) |
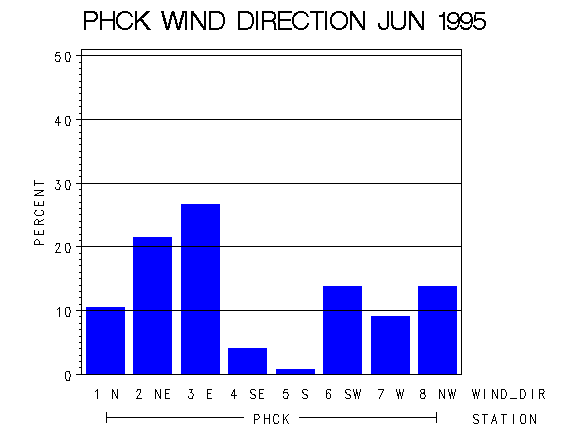 |
| Frequency of Wind Direction |
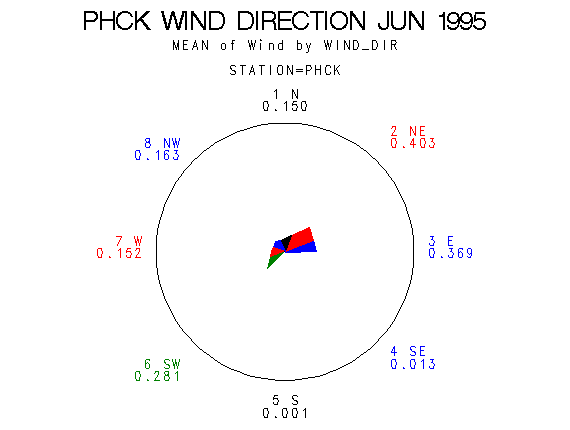 |
| Wind Vectors (circle=1.5 m/s) |
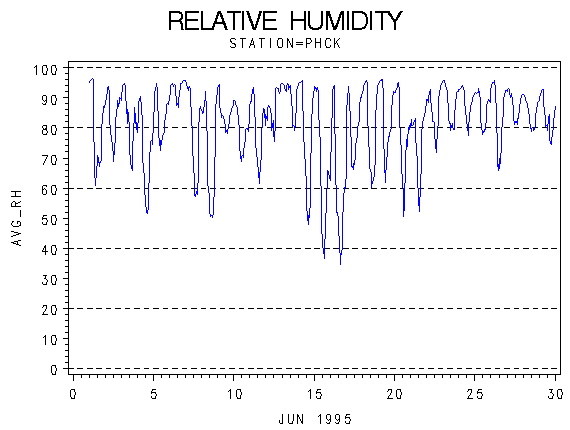 |
| Relative Humidity (percent) |
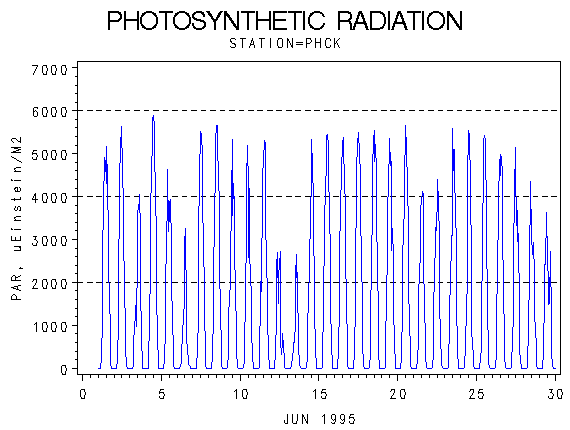 |
| Photosynthetically Active Radiation (micro-einsteins per m squared) |
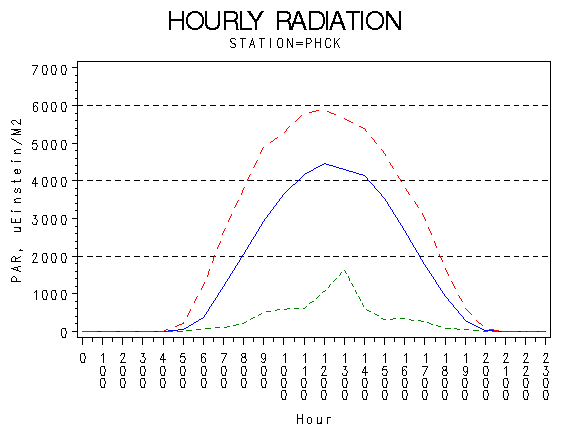 |
| Hourly Photosynthetically Active Radiation (micro-einsteins per m squared) |
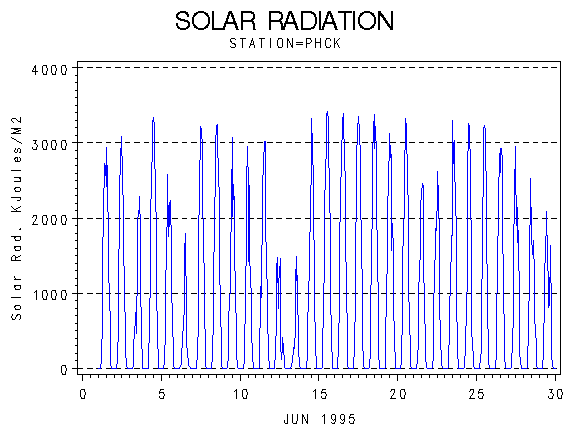 |
| Solar Radiation (KiloJoules per Meter Squared) |
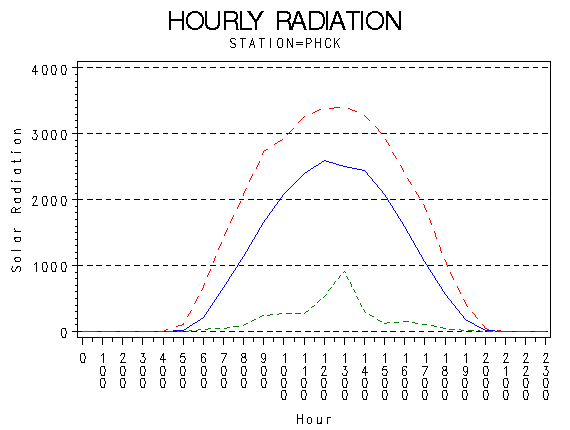 |
| Hourly Solar Radiation (KiloJoules per Meter Squared) |
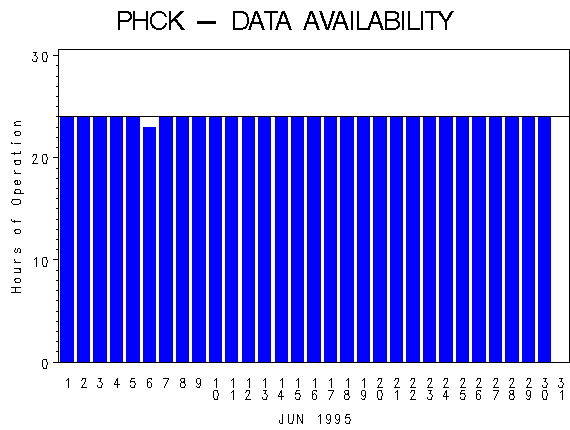 |
| Hours of Station Operation |
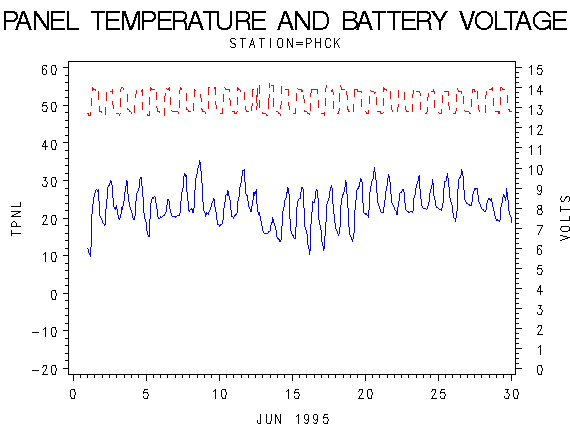 |
| Data Logger Battery Voltage and Internal Logger Temperature |