

| VIRGINIA COAST RESERVE LONG-TERM ECOLOGICAL RESEARCH |
Site PHCK, Month MAY, Year 1995 |

| 
|
| Day of Month | Precip (mm) | Max Temp. oC | Min Temp. oC | Mean Temp. oC | Wind Speed (m/s) | Wind Dir (deg.) | Vapor Press. (mb) | Solar Rad. KJ/m2 | PAR uE/m2 |
|---|---|---|---|---|---|---|---|---|---|
| 1 | 0.00 | 15 | 11 | 12.3 | 1.78 | 5 | 11.50 | 7873 | 14448 |
| 2 | 36.40 | 12 | 9 | 10.3 | 2.99 | 44 | 11.41 | 3513 | 7195 |
| 3 | 0.00 | 19 | 9 | 13.1 | 2.05 | 331 | 9.73 | 27845 | 47868 |
| 4 | 0.00 | 20 | 11 | 15.2 | 1.35 | 242 | 11.71 | 15055 | 26711 |
| 5 | 2.30 | 20 | 15 | 16.8 | 2.54 | 309 | 14.74 | 16727 | 29815 |
| 6 | 0.00 | 22 | 9 | 16.2 | 2.91 | 318 | 10.93 | 27446 | 46680 |
| 7 | 0.00 | 21 | 9 | 15.2 | 1.34 | 327 | 8.90 | 28414 | 48112 |
| 8 | 0.00 | 19 | 7 | 14.0 | 2.76 | 358 | 6.89 | 29341 | 49604 |
| 9 | 0.50 | 22 | 6 | 14.7 | 0.84 | 234 | 9.90 | 22984 | 40606 |
| 10 | 10.70 | 27 | 15 | 20.3 | 1.67 | 238 | 20.61 | 15682 | 28246 |
| 11 | 2.80 | 27 | 17 | 21.2 | 2.06 | 252 | 21.39 | 20071 | 36121 |
| 12 | 0.80 | 23 | 12 | 18.4 | 1.92 | 342 | 15.45 | 23851 | 41361 |
| 13 | 0.00 | 25 | 11 | 19.0 | 1.16 | 301 | 14.42 | 25609 | 44493 |
| 14 | 18.30 | 19 | 14 | 15.5 | 1.75 | 71 | 15.91 | 6534 | 12594 |
| 15 | 0.30 | 24 | 14 | 18.8 | 1.84 | 345 | 16.30 | 24486 | 42543 |
| 16 | 0.00 | 22 | 12 | 17.8 | 1.13 | 108 | 12.85 | 26962 | 46324 |
| 17 | 0.00 | 28 | 19 | 23.4 | 4.46 | 223 | 22.20 | 12657 | 23344 |
| 18 | 0.00 | 31 | 23 | 26.5 | 4.02 | 238 | 25.23 | 16234 | 28807 |
| 19 | 5.90 | 26 | 12 | 21.3 | 3.34 | 259 | 20.04 | 11032 | 20362 |
| 20 | 0.00 | 26 | 10 | 18.8 | 1.57 | 271 | 14.18 | 28858 | 49099 |
| 21 | 0.00 | 28 | 18 | 22.3 | 3.27 | 242 | 15.64 | 27055 | 46651 |
| 22 | 0.00 | 26 | 13 | 20.5 | 1.38 | 318 | 15.31 | 28139 | 48670 |
| 23 | 0.00 | 25 | 10 | 19.2 | 0.60 | 156 | 12.88 | 29489 | 50250 |
| 24 | 0.00 | 28 | 15 | 22.3 | 2.82 | 224 | 18.75 | 27772 | 48702 |
| 25 | 4.30 | 30 | 20 | 24.1 | 2.77 | 230 | 20.05 | 26552 | 46916 |
| 26 | 3.60 | 24 | 16 | 20.2 | 1.86 | 50 | 21.26 | 14063 | 25312 |
| 27 | 0.00 | 18 | 15 | 16.3 | 2.51 | 64 | 15.35 | 7974 | 14826 |
| 28 | 1.10 | 20 | 15 | 18.0 | 1.07 | 77 | 17.35 | 7768 | 14915 |
| 29 | 0.00 | 30 | 19 | 23.7 | 3.30 | 221 | 23.25 | 21984 | 39392 |
| 30 | 0.00 | 26 | 15 | 22.3 | 3.08 | 317 | 17.21 | 21418 | 37113 |
| 31 | 0.00 | 26 | 13 | 19.6 | 0.75 | 52 | 16.17 | 27463 | 48073 |
| Mon. Tot. Precip. 87.0 mm | Mean wind vel. 2.157 m/s |
| Mon. Mean Temp. 18.6 deg. C | Wind dir 280 deg |
| Mean Max. Temp. 23.6 deg. C | Mean Min. Temp. 13.4 deg. C |
| Extreme Max. Temp 31.1 deg. C | Mean vapor press 15.73 mb |
| Extreme Min. Temp 6.1 deg. C | Total Solar Rad 630848 KJ/sq. m |
| Total photosyn. 1105152 uEin/sq.m |
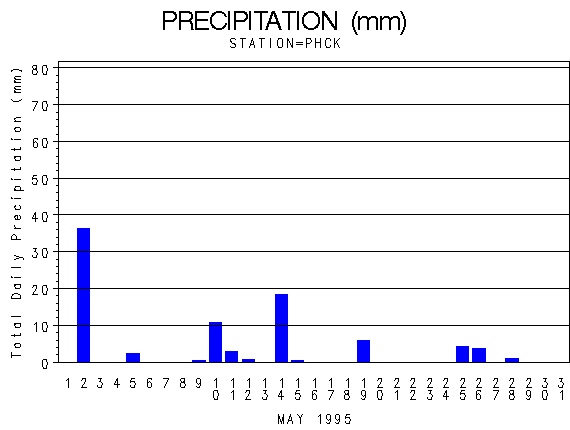 |
| Daily Total Precipitation (mm) |

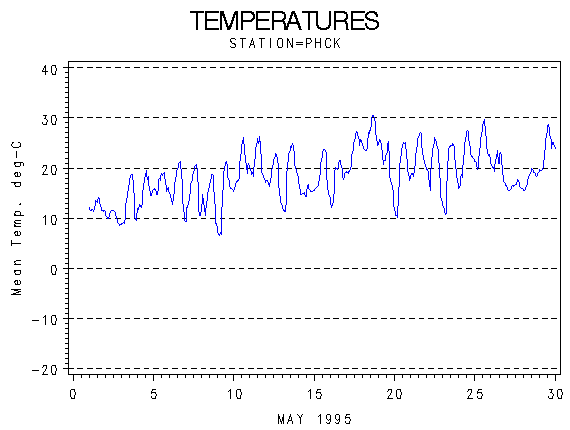 |
| Hourly Mean Temperatures (deg. C) |

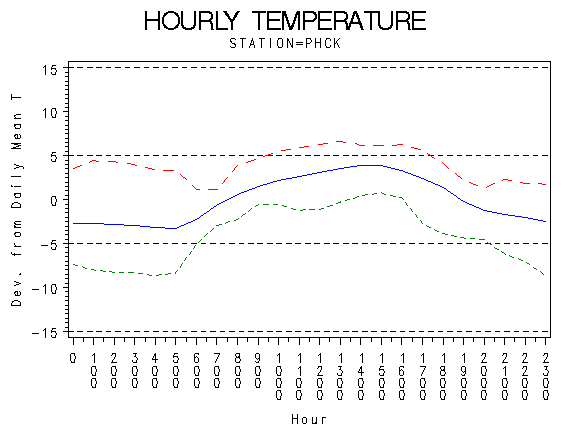 |
| Hourly Max Min and Mean Temperatures (deg. C) |

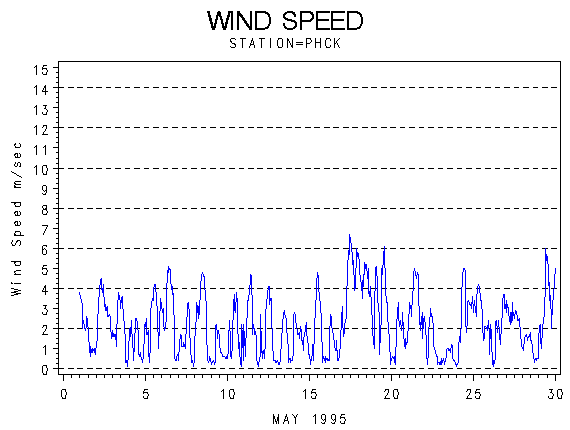 |
| Wind Speed (m/s) |

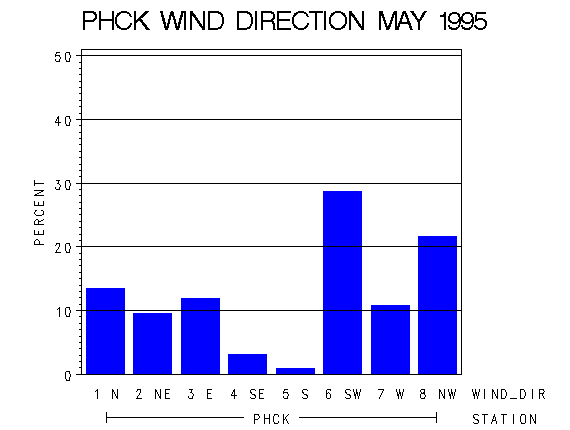 |
| Frequency of Wind Direction |

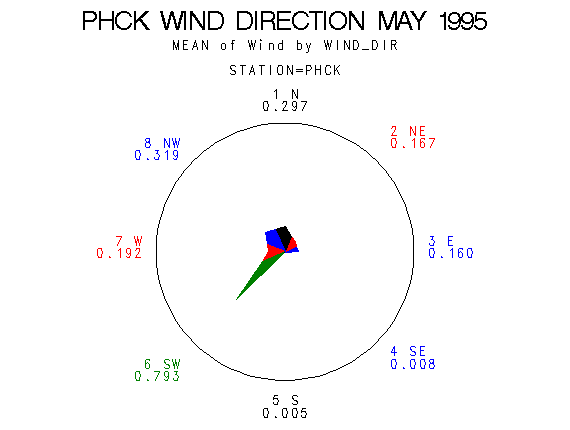 |
| Wind Vectors (circle=1.5 m/s) |

 |
| Relative Humidity (percent) |

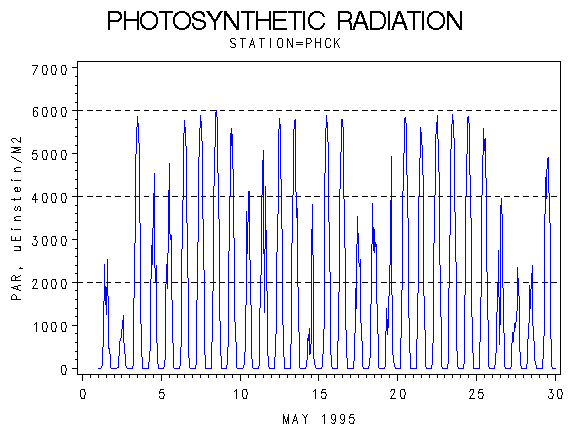 |
| Photosynthetically Active Radiation (micro-einsteins per m squared) |

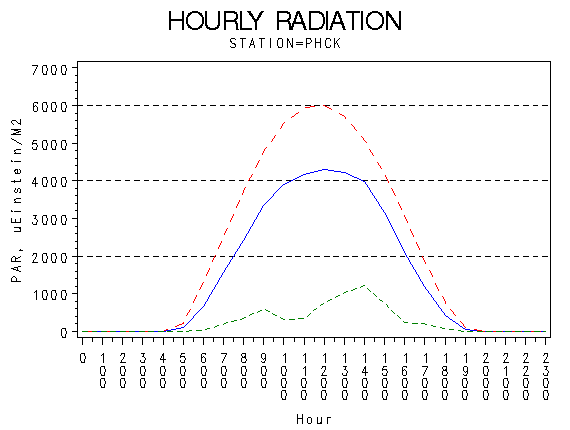 |
| Hourly Photosynthetically Active Radiation (micro-einsteins per m squared) |

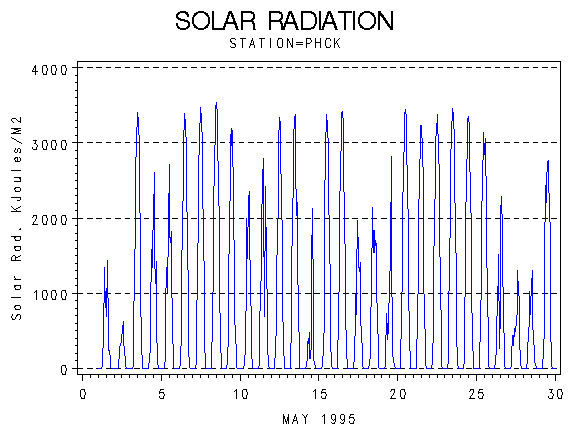 |
| Solar Radiation (KiloJoules per Meter Squared) |

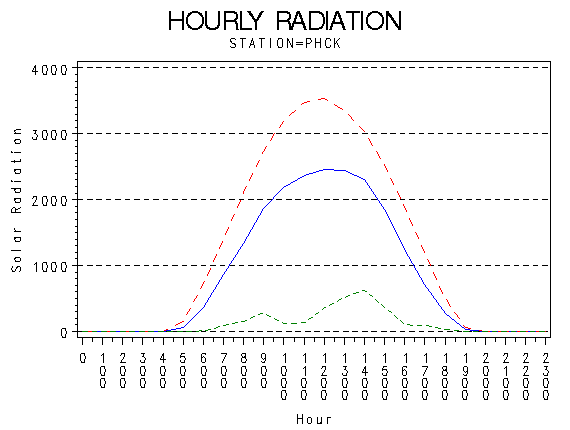 |
| Hourly Solar Radiation (KiloJoules per Meter Squared) |

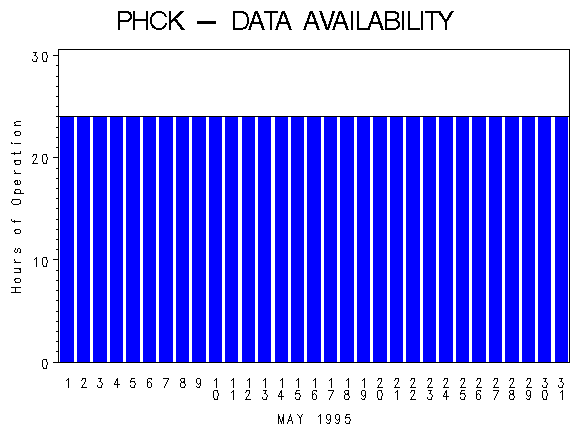 |
| Hours of Station Operation |

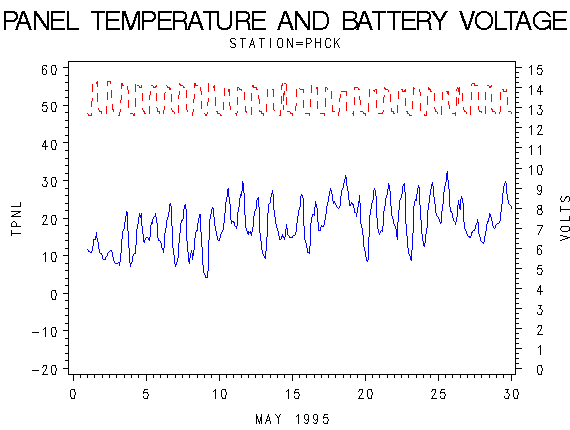 |
| Data Logger Battery Voltage and Internal Logger Temperature |
