

| VIRGINIA COAST RESERVE LONG-TERM ECOLOGICAL RESEARCH |
Site PHCK, Month NOV, Year 1994 |

| 
|
| Day of Month | Precip (mm) | Max Temp. oC | Min Temp. oC | Mean Temp. oC | Wind Speed (m/s) | Wind Dir (deg.) | Vapor Press. (mb) | Solar Rad. KJ/m2 | PAR uE/m2 |
|---|---|---|---|---|---|---|---|---|---|
| 1 | 4.60 | 26 | 12 | 18.9 | 3.53 | 248 | 17.17 | 8836 | 15930 |
| 2 | 0.00 | 18 | 5 | 12.5 | 3.87 | 281 | 9.42 | 13452 | 23528 |
| 3 | 0.00 | 19 | -53 | 11.2 | 0.58 | 276 | 11.88 | 13361 | 23428 |
| 4 | 0.00 | 24 | 5 | 14.7 | 1.17 | 220 | 14.28 | 13466 | 23254 |
| 5 | 0.00 | 25 | 13 | 17.7 | 2.17 | 229 | 18.74 | 10252 | 18559 |
| 6 | 0.30 | 25 | 17 | 20.4 | 3.64 | 230 | 21.14 | 9144 | 16841 |
| 7 | 0.00 | 19 | 4 | 13.1 | 3.01 | 346 | 10.01 | 13062 | 23012 |
| 8 | 0.00 | 21 | 2 | 12.1 | 1.98 | 236 | 11.93 | 12230 | 22221 |
| 9 | 0.00 | 23 | 13 | 17.1 | 2.19 | 250 | 14.67 | 12489 | 21914 |
| 10 | 0.00 | 18 | 2 | 10.7 | 2.37 | 340 | 12.52 | 2880 | 5678 |
| 11 | 0.00 | 11 | 1 | 5.7 | 1.86 | 14 | 7.18 | 12529 | 21940 |
| 12 | 0.00 | 15 | -1 | 6.9 | 0.76 | 22 | 8.37 | 12242 | 21662 |
| 13 | 0.00 | 21 | 2 | 9.4 | 0.73 | 279 | 9.65 | 11696 | 20939 |
| 14 | 0.00 | 20 | 4 | 11.9 | 0.73 | 61 | 13.77 | 11104 | 20076 |
| 15 | 0.00 | 23 | 7 | 13.5 | 0.81 | 273 | 15.65 | 10652 | 19290 |
| 16 | 0.00 | 16 | 10 | 13.4 | 4.32 | 51 | 15.22 | 3734 | 7058 |
| 17 | 0.00 | 17 | 12 | 14.6 | 6.45 | 53 | 16.85 | 3995 | 7744 |
| 18 | 0.00 | 19 | 15 | 17.3 | 4.71 | 39 | 20.63 | 2667 | 5457 |
| 19 | 0.00 | 17 | 12 | 15.2 | 3.40 | 355 | 13.35 | 11451 | 19985 |
| 20 | 0.00 | 16 | 9 | 12.5 | 2.42 | 52 | 11.81 | 10748 | 19404 |
| 21 | 0.00 | 19 | 14 | 17.3 | 1.30 | 144 | 20.10 | 2336 | 4632 |
| 22 | 0.00 | 19 | 8 | 14.3 | 2.61 | 327 | 12.86 | 11050 | 19309 |
| 23 | 0.00 | 10 | 6 | 7.7 | 3.77 | 301 | 4.57 | 10237 | 17073 |
| 24 | 0.00 | 8 | -1 | 3.9 | 3.28 | 333 | 4.94 | 11115 | 19224 |
| 25 | 0.00 | 13 | 6 | 8.6 | 2.99 | 249 | 7.42 | 8254 | 14494 |
| 26 | 0.00 | 13 | 5 | 8.9 | 1.84 | 12 | 7.17 | 8646 | 15328 |
| 27 | 0.00 | 15 | 4 | 10.1 | 1.71 | 69 | 11.08 | 1737 | 3458 |
| 28 | 0.00 | 22 | 13 | 16.8 | 3.25 | 230 | 19.93 | 3522 | 6820 |
| 29 | 0.00 | 16 | 7 | 10.9 | 0.88 | 272 | 10.92 | 5116 | 9233 |
| 30 | 0.00 | 13 | 1 | 8.4 | 1.18 | 341 | 9.67 | 8933 | 15526 |
| Mon. Tot. Precip. 4.9 mm | Mean wind vel. 2.450 m/s |
| Mon. Mean Temp. 12.5 deg. C | Wind dir 327 deg |
| Mean Max. Temp. 18.0 deg. C | Mean Min. Temp. 5.0 deg. C |
| Extreme Max. Temp 26.0 deg. C | Mean vapor press 12.76 mb |
| Extreme Min. Temp -53.4 deg. C | Total Solar Rad 270930 KJ/sq. m |
| Total photosyn. 483013 uEin/sq.m |
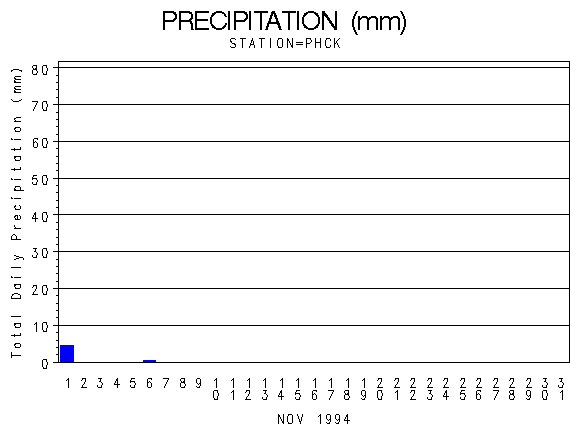 |
| Daily Total Precipitation (mm) |

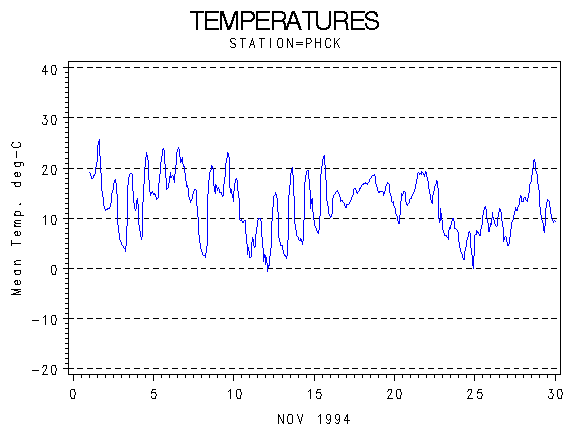 |
| Hourly Mean Temperatures (deg. C) |

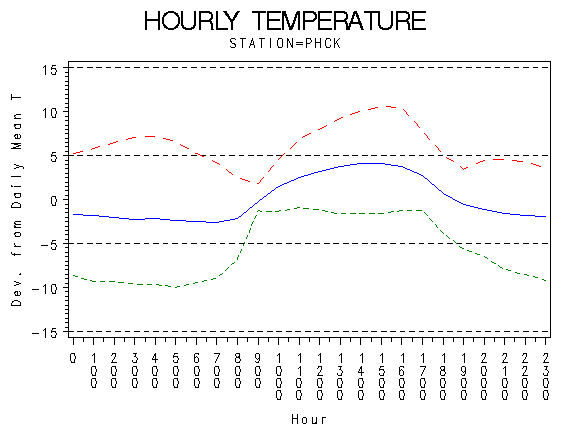 |
| Hourly Max Min and Mean Temperatures (deg. C) |

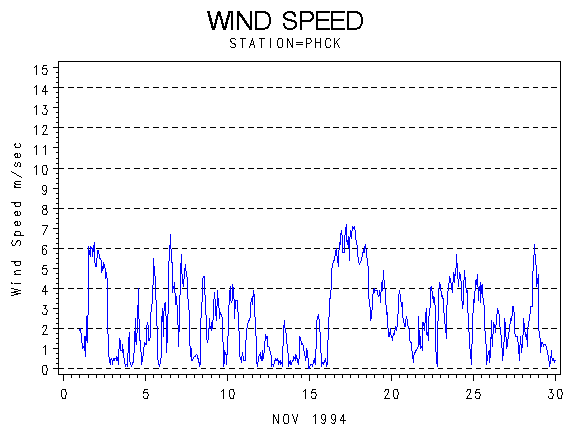 |
| Wind Speed (m/s) |

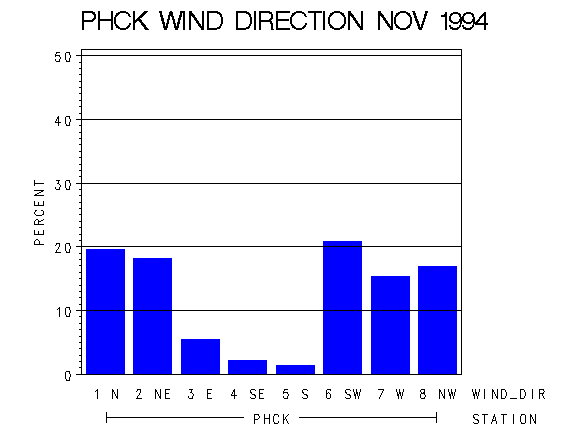 |
| Frequency of Wind Direction |

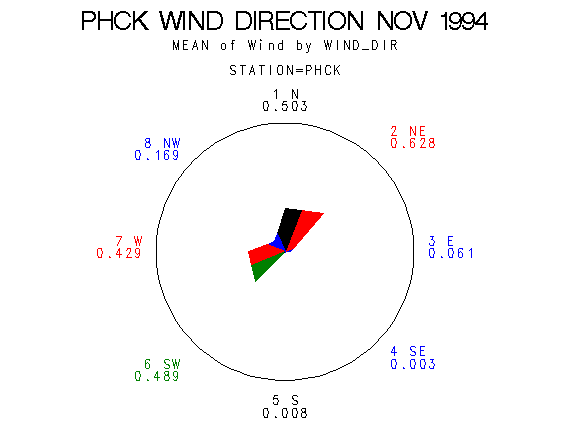 |
| Wind Vectors (circle=1.5 m/s) |

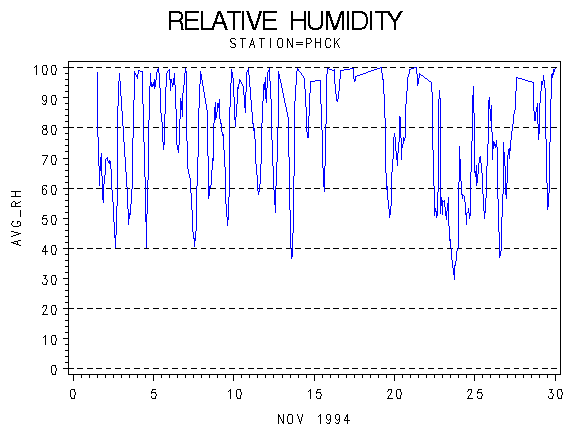 |
| Relative Humidity (percent) |

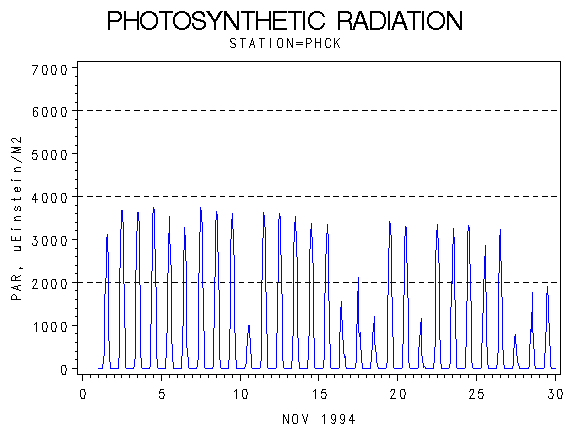 |
| Photosynthetically Active Radiation (micro-einsteins per m squared) |

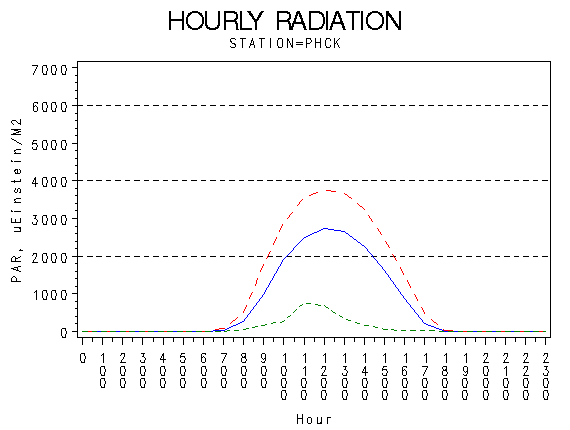 |
| Hourly Photosynthetically Active Radiation (micro-einsteins per m squared) |

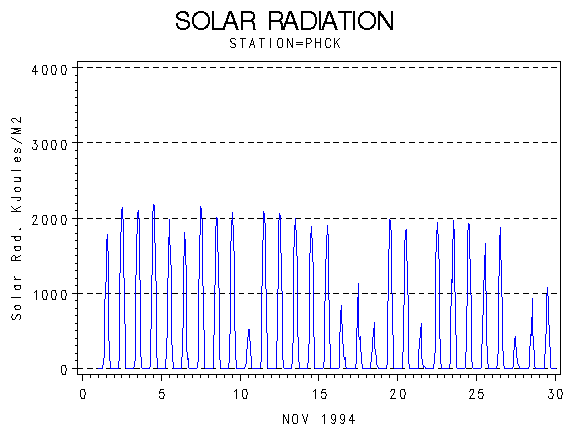 |
| Solar Radiation (KiloJoules per Meter Squared) |

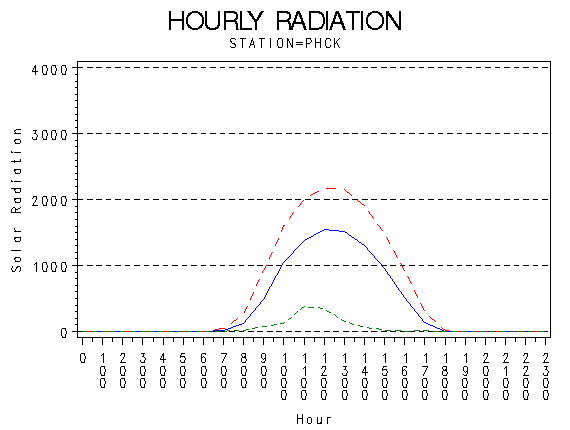 |
| Hourly Solar Radiation (KiloJoules per Meter Squared) |

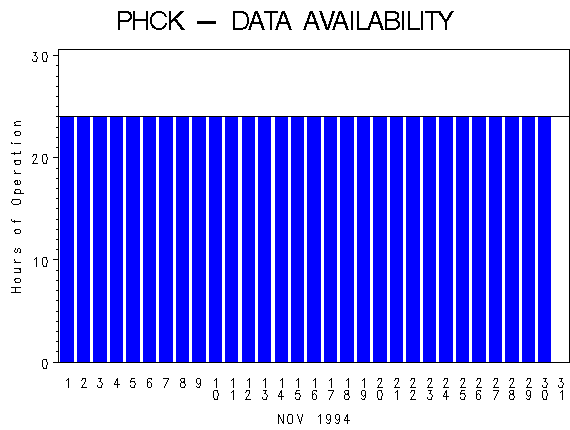 |
| Hours of Station Operation |

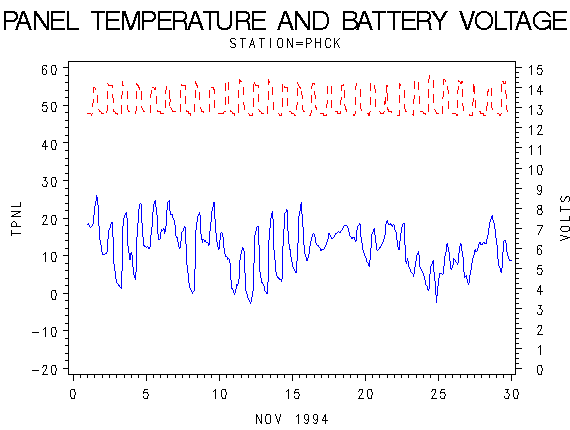 |
| Data Logger Battery Voltage and Internal Logger Temperature |
