

| VIRGINIA COAST RESERVE LONG-TERM ECOLOGICAL RESEARCH |
Site PHCK, Month AUG, Year 1994 |

| 
|
| Day of Month | Precip (mm) | Max Temp. oC | Min Temp. oC | Mean Temp. oC | Wind Speed (m/s) | Wind Dir (deg.) | Vapor Press. (mb) | Solar Rad. KJ/m2 | PAR uE/m2 |
|---|---|---|---|---|---|---|---|---|---|
| 1 | 8.90 | 28 | 22 | 24.4 | 0.02 | 273 | 30.56 | 9549 | 89097 |
| 2 | 31.50 | 30 | 21 | 24.6 | 0.02 | 242 | 31.24 | 5543 | 81578 |
| 3 | 0.30 | 30 | 22 | 25.9 | 0.08 | 278 | 31.10 | 6361 | 88911 |
| 4 | 0.00 | 33 | 23 | 27.4 | 0.23 | 230 | 31.26 | 3250 | 89832 |
| 5 | 32.70 | 31 | 20 | 25.1 | 0.30 | 238 | 30.34 | 5700 | 68907 |
| 6 | 0.00 | 23 | 16 | 19.0 | 0.20 | 26 | 19.34 | 4127 | 90558 |
| 7 | 0.00 | 24 | 14 | 19.2 | 0.20 | 50 | 19.31 | 3654 | 90034 |
| 8 | 0.00 | 25 | 15 | 20.0 | 0.11 | 58 | 20.25 | 3861 | 90015 |
| 9 | 0.00 | 26 | 13 | 19.8 | 0.04 | 87 | 20.20 | 3551 | 89989 |
| 10 | 0.00 | 30 | 15 | 22.3 | 0.04 | 225 | 23.24 | 2460 | 88472 |
| 11 | 0.00 | 29 | 19 | 24.1 | 0.03 | 118 | 27.24 | 6224 | 87889 |
| 12 | 0.00 | 31 | 23 | 26.6 | 0.13 | 228 | 33.25 | 5886 | 88475 |
| 13 | 0.00 | 33 | 25 | 28.5 | 0.32 | 233 | 33.06 | 2589 | 88733 |
| 14 | 0.00 | 33 | 24 | 28.3 | 0.42 | 232 | 32.70 | 5646 | 87553 |
| 15 | 24.40 | 24 | 18 | 20.6 | 0.07 | 347 | 23.36 | 7503 | 78254 |
| 16 | 0.00 | 24 | 17 | 19.7 | 0.02 | 164 | 22.14 | 3973 | 49342 |
| 26 | 0.00 | 29 | 19 | 25.1 | 1.34 | 231 | 28.29 | 13731 | 23448 |
| 27 | 0.00 | 31 | 18 | 24.2 | 0.94 | 291 | 27.70 | 18082 | 31227 |
| 28 | 0.00 | 31 | 19 | 25.2 | 1.29 | 237 | 28.66 | 20897 | 35474 |
| 29 | 7.90 | 31 | 20 | 25.9 | 2.85 | 260 | 29.53 | 17434 | 30653 |
| 30 | 0.00 | 27 | 15 | 21.5 | 0.61 | 54 | 19.93 | 23599 | 40607 |
| 31 | 0.00 | 29 | 15 | 22.4 | 0.99 | 227 | 24.56 | 21871 | 38554 |
| Mon. Tot. Precip. 105.7 mm | Mean wind vel. 0.466 m/s |
| Mon. Mean Temp. 23.6 deg. C | Wind dir 249 deg |
| Mean Max. Temp. 28.7 deg. C | Mean Min. Temp. 18.8 deg. C |
| Extreme Max. Temp 32.8 deg. C | Mean vapor press 26.69 mb |
| Extreme Min. Temp 13.5 deg. C | Total Solar Rad 195489 KJ/sq. m |
| Total photosyn. 1547600 uEin/sq.m |
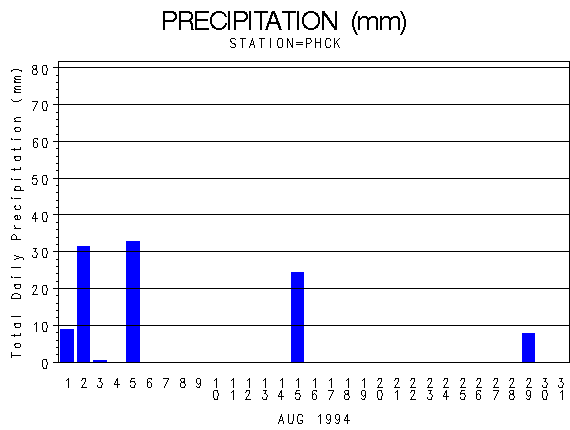 |
| Daily Total Precipitation (mm) |

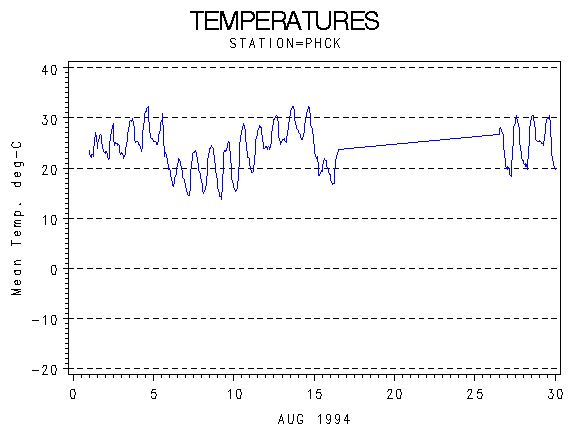 |
| Hourly Mean Temperatures (deg. C) |

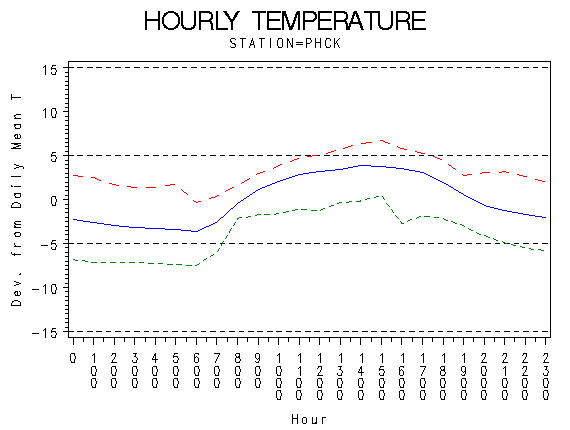 |
| Hourly Max Min and Mean Temperatures (deg. C) |

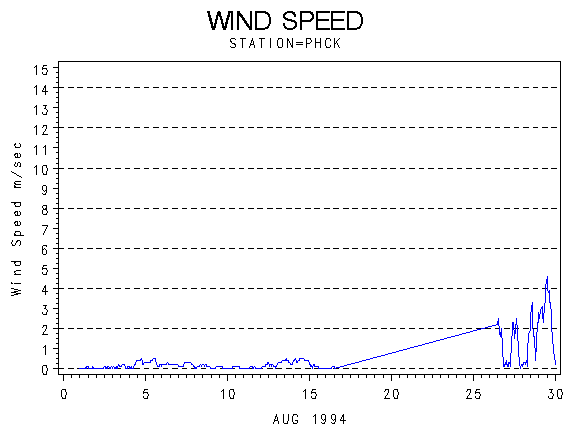 |
| Wind Speed (m/s) |

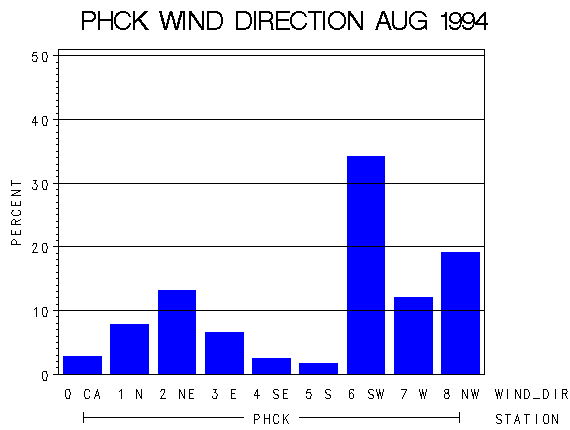 |
| Frequency of Wind Direction |

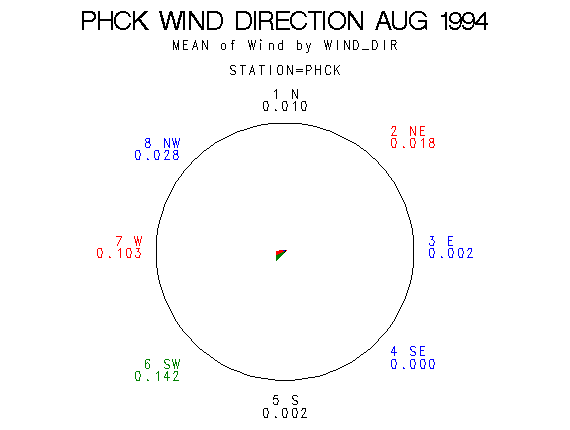 |
| Wind Vectors (circle=1.5 m/s) |

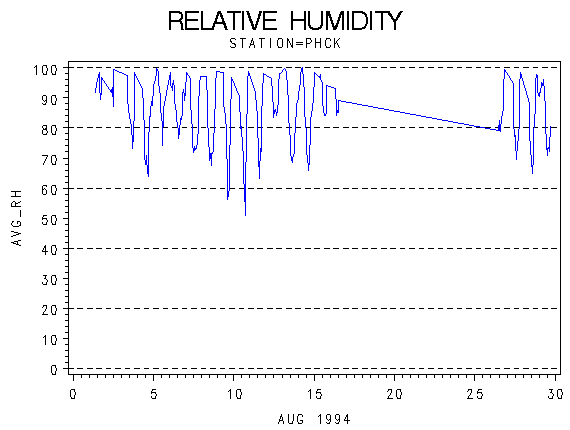 |
| Relative Humidity (percent) |

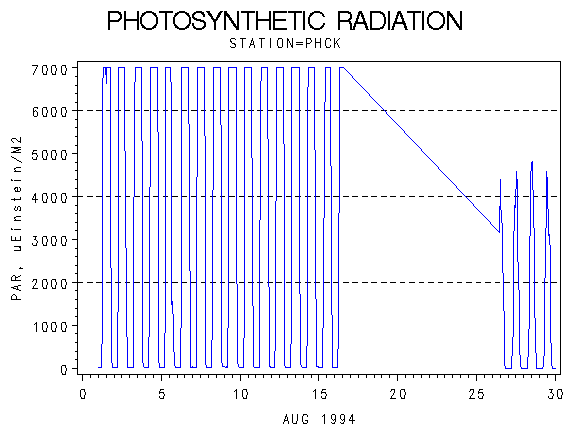 |
| Photosynthetically Active Radiation (micro-einsteins per m squared) |

 |
| Hourly Photosynthetically Active Radiation (micro-einsteins per m squared) |

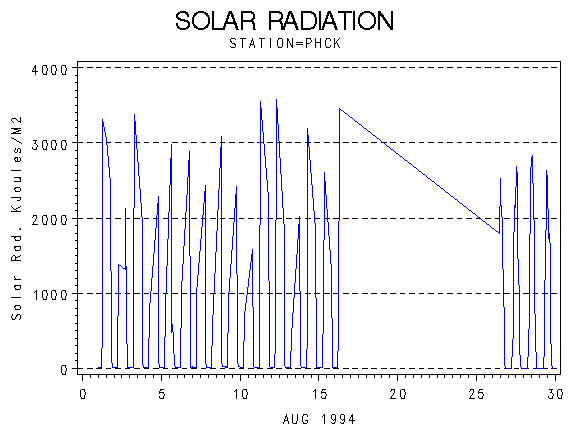 |
| Solar Radiation (KiloJoules per Meter Squared) |

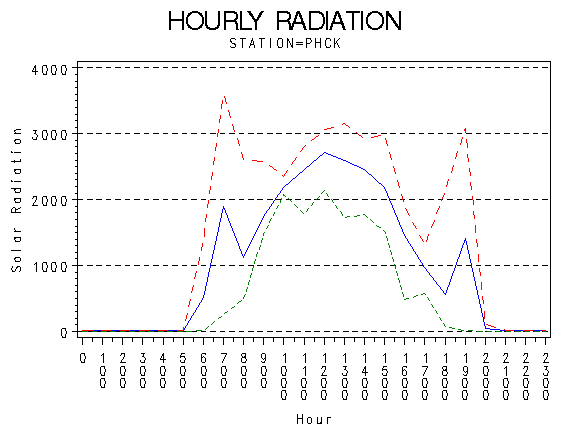 |
| Hourly Solar Radiation (KiloJoules per Meter Squared) |

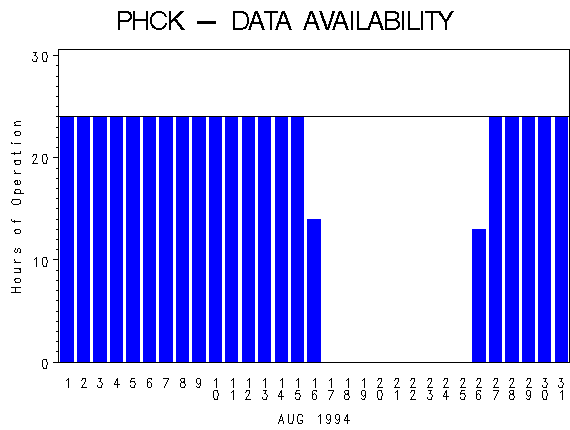 |
| Hours of Station Operation |

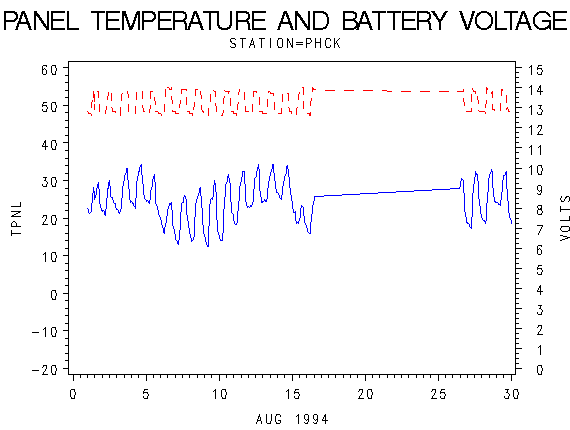 |
| Data Logger Battery Voltage and Internal Logger Temperature |
