
|
| VIRGINIA COAST RESERVE LONG-TERM ECOLOGICAL RESEARCH |
Site PHCK, Month JUN, Year 1994 |

| 
|
| Day of Month | Precip (mm) | Max Temp. oC | Min Temp. oC | Mean Temp. oC | Wind Speed (m/s) | Wind Dir (deg.) | Vapor Press. (mb) | Solar Rad. KJ/m2 | PAR uE/m2 |
|---|---|---|---|---|---|---|---|---|---|
| 1 | 25.70 | 31 | 19 | 24.0 | 3.20 | 254 | 24.25 | 25314 | 45741 |
| 2 | 0.00 | 23 | 13 | 19.4 | 1.84 | 340 | 16.65 | 27756 | 49374 |
| 3 | 0.00 | 22 | 11 | 17.0 | 1.27 | 76 | 15.49 | 29735 | 52105 |
| 4 | 0.00 | 26 | 12 | 19.7 | 0.83 | 307 | 16.56 | 28669 | 50021 |
| 5 | 0.00 | 26 | 12 | 20.5 | 0.71 | 209 | 19.97 | 20167 | 35792 |
| 6 | 14.20 | 28 | 20 | 23.2 | 3.10 | 220 | 26.08 | 18619 | 34523 |
| 7 | 0.00 | 31 | 22 | 25.4 | 3.38 | 233 | 29.16 | 21190 | 39293 |
| 8 | 0.30 | 26 | 18 | 22.7 | 2.44 | 331 | 25.76 | 8309 | 16317 |
| 9 | 0.00 | 24 | 16 | 19.9 | 1.18 | 45 | 17.00 | 26634 | 46556 |
| 10 | 0.00 | 26 | 12 | 19.9 | 0.48 | 114 | 17.74 | 24803 | 44120 |
| 11 | 0.00 | 25 | 18 | 21.8 | 0.58 | 131 | 23.04 | 12660 | 24194 |
| 12 | 0.00 | 29 | 21 | 24.0 | 0.79 | 206 | 26.77 | 22929 | 41905 |
| 13 | 0.00 | 29 | 21 | 25.1 | 0.86 | 201 | 29.58 | 27393 | 49152 |
| 14 | 0.00 | 31 | 23 | 26.5 | 1.28 | 214 | 31.56 | 26981 | 48213 |
| 15 | 0.00 | 32 | 23 | 27.4 | 0.72 | 215 | 32.65 | 24604 | 44110 |
| 16 | 0.00 | 31 | 22 | 26.3 | 0.48 | 179 | 31.89 | 18201 | 32739 |
| 17 | 0.00 | 29 | 21 | 25.4 | 0.71 | 77 | 31.07 | 17657 | 32352 |
| 18 | 0.00 | 30 | 23 | 26.1 | 0.85 | 210 | 30.76 | 24973 | 44985 |
| 19 | 0.00 | 33 | 23 | 27.4 | 2.08 | 240 | 29.76 | 25986 | 46708 |
| 20 | 0.00 | 30 | 22 | 25.5 | 2.18 | 58 | 30.26 | 23852 | 43263 |
| 21 | 2.60 | 31 | 23 | 26.3 | 1.36 | 210 | 31.78 | 21673 | 38781 |
| 22 | 1.30 | 32 | 22 | 26.5 | 2.05 | 322 | 25.36 | 28518 | 49800 |
| 23 | 7.60 | 30 | 22 | 25.4 | 1.27 | 231 | 29.96 | 15356 | 27876 |
| 24 | 1.30 | 33 | 24 | 28.4 | 3.49 | 229 | 31.87 | 26089 | 47510 |
| 25 | 0.00 | 31 | 22 | 27.3 | 4.61 | 240 | 26.69 | 25094 | 45547 |
| 26 | 0.00 | 30 | 19 | 25.2 | 1.97 | 228 | 27.08 | 27410 | 48920 |
| 27 | 0.00 | 29 | 23 | 24.5 | 3.73 | 218 | 26.57 | 17385 | 32262 |
| 28 | 0.00 | 31 | 22 | 25.0 | 2.64 | 230 | 27.20 | 26598 | 47735 |
| 29 | 13.60 | 30 | 21 | 25.3 | 2.88 | 223 | 30.04 | 17282 | 31336 |
| 30 | 0.00 | 29 | 21 | 24.5 | 2.46 | 235 | 26.06 | 20195 | 36570 |
| Mon. Tot. Precip. 66.6 mm | Mean wind vel. 1.848 m/s |
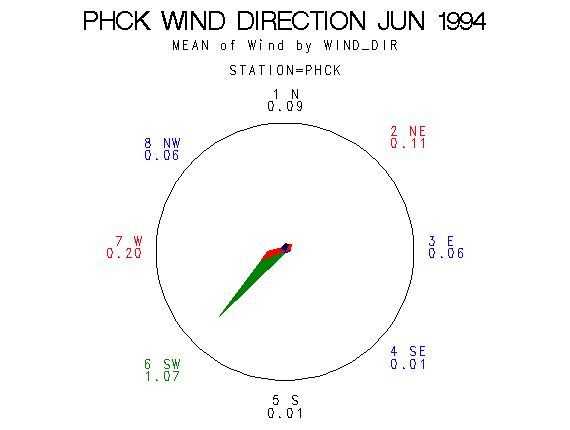
| Mon. Mean Temp. 24.2 deg. C | Wind dir 234 deg |
| Mean Max. Temp. 28.9 deg. C | Mean Min. Temp. 19.7 deg. C |
| Extreme Max. Temp 33.3 deg. C | Mean vapor press 26.29 mb |
| Extreme Min. Temp 10.8 deg. C | Total Solar Rad 682033 KJ/sq. m |
| Total photosyn. 1227797 uEin/sq.m |
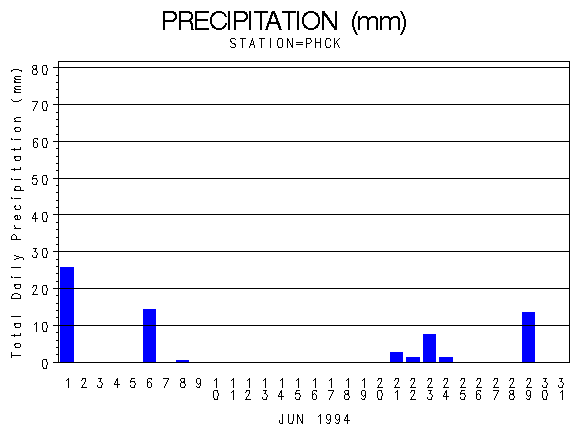 |
| Daily Total Precipitation (mm) |

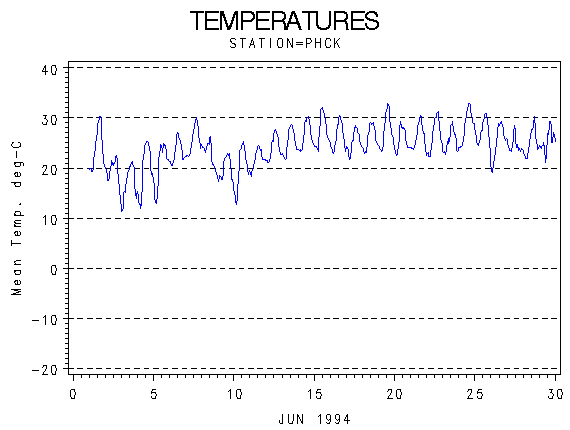 |
| Hourly Mean Temperatures (deg. C) |
 |
| Hourly Max Min and Mean Temperatures (deg. C) |
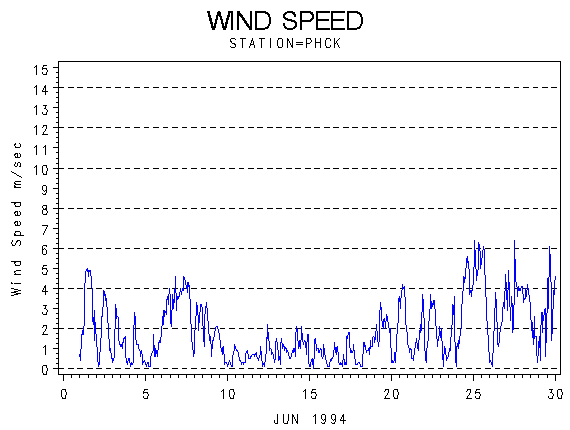 |
| Wind Speed (m/s) |
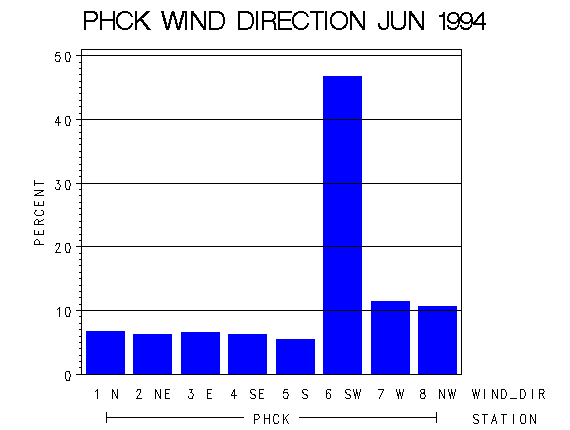 |
| Frequency of Wind Direction |
 |
| Wind Vectors (circle=1.5 m/s) |
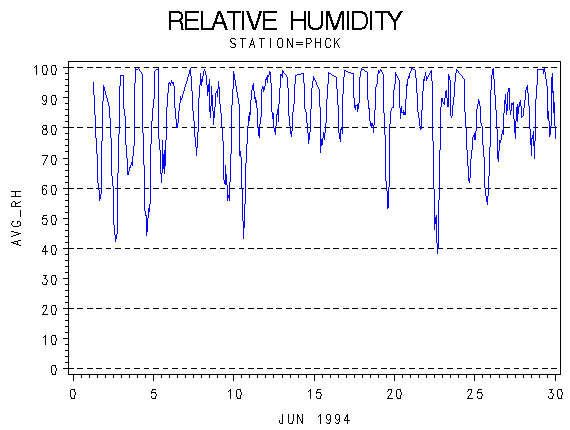 |
| Relative Humidity (percent) |
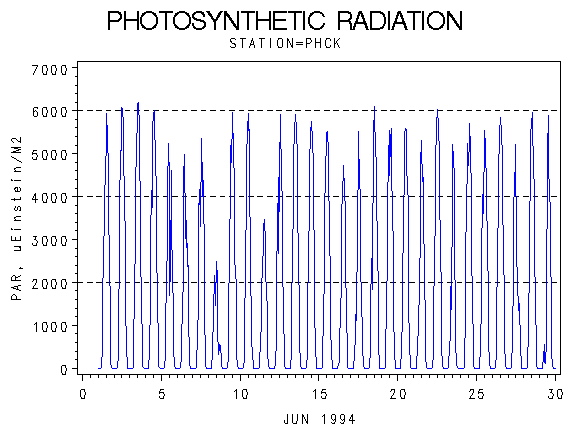 |
| Photosynthetically Active Radiation (micro-einsteins per m squared) |
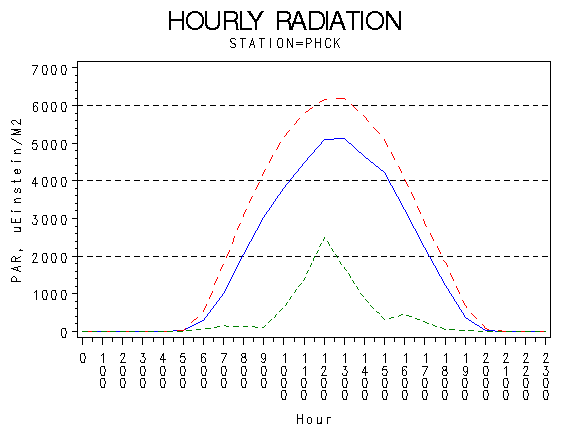 |
| Hourly Photosynthetically Active Radiation (micro-einsteins per m squared) |
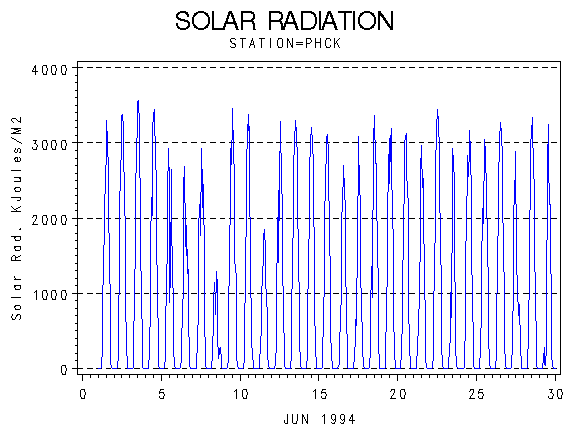 |
| Solar Radiation (KiloJoules per Meter Squared) |
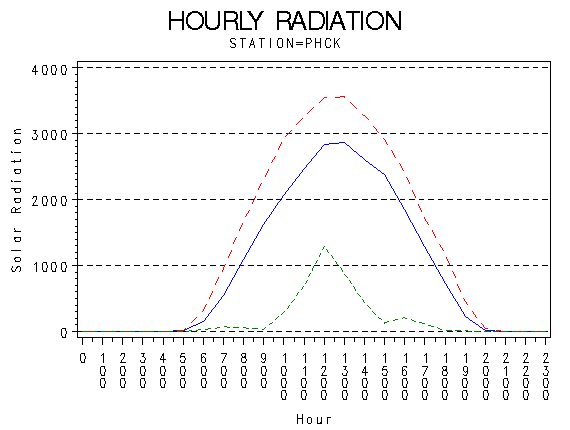 |
| Hourly Solar Radiation (KiloJoules per Meter Squared) |
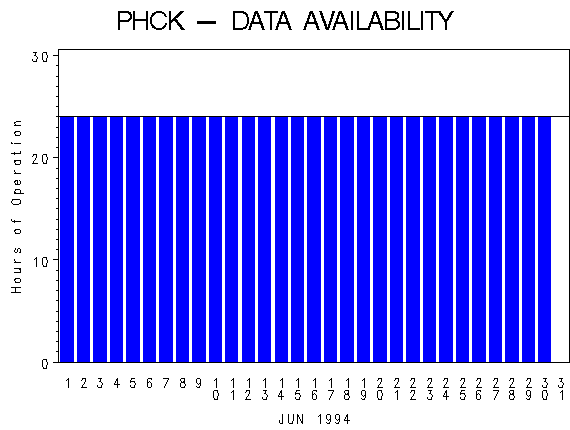 |
| Hours of Station Operation |
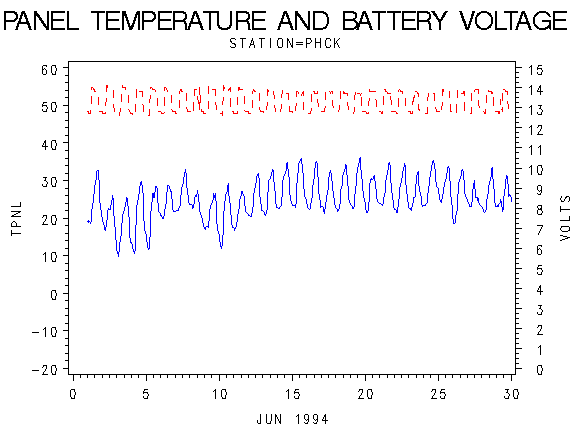 |
| Data Logger Battery Voltage and Internal Logger Temperature |