

| VIRGINIA COAST RESERVE LONG-TERM ECOLOGICAL RESEARCH |
Site PHCK, Month AUG, Year 1993 |

| 
|
| Day of Month | Precip (mm) | Max Temp. oC | Min Temp. oC | Mean Temp. oC | Wind Speed (m/s) | Wind Dir (deg.) | Vapor Press. (mb) | Solar Rad. KJ/m2 | PAR uE/m2 |
|---|---|---|---|---|---|---|---|---|---|
| 1 | 0.00 | 31 | 18 | 24.7 | 1.36 | 244 | 24.31 | 21630 | 40324 |
| 2 | 0.00 | 34 | 22 | 27.8 | 2.25 | 223 | 28.11 | 24837 | 45729 |
| 3 | 0.30 | 32 | 24 | 27.2 | 2.69 | 232 | 29.73 | 14599 | 27680 |
| 4 | 0.00 | 32 | 22 | 26.3 | 1.76 | 275 | 26.77 | 20657 | 38369 |
| 5 | 4.10 | 28 | 18 | 23.2 | 0.85 | 65 | 23.19 | 21279 | 38880 |
| 6 | 42.10 | 25 | 19 | 22.3 | 1.41 | 258 | 25.87 | 3735 | 7936 |
| 7 | 0.00 | 26 | 19 | 21.8 | 1.44 | 331 | 23.02 | 21710 | 39598 |
| 8 | 0.00 | 27 | 17 | 22.3 | 0.44 | 103 | 24.17 | 24178 | 43350 |
| 9 | 0.00 | 26 | 19 | 23.4 | 1.32 | 72 | 24.06 | 24720 | 44379 |
| 10 | 0.00 | 26 | 17 | 22.4 | 0.98 | 69 | 22.72 | 25172 | 45609 |
| 11 | 0.00 | 27 | 16 | 21.7 | 0.57 | 66 | 22.25 | 21934 | 39883 |
| 12 | 0.50 | 29 | 16 | 22.6 | 0.53 | 215 | 24.34 | 20751 | 38077 |
| 13 | 6.30 | 28 | 21 | 24.1 | 1.55 | 234 | 27.62 | 12127 | 22610 |
| 14 | 0.00 | 29 | 19 | 23.9 | 0.83 | 77 | 26.71 | 24180 | 43799 |
| 15 | 0.00 | 32 | 18 | 24.8 | 0.80 | 321 | 26.39 | 21485 | 39319 |
| 16 | 0.00 | 30 | 19 | 24.9 | 0.65 | 208 | 28.18 | 22913 | 41892 |
| 17 | 21.80 | 29 | 21 | 25.6 | 1.73 | 239 | 28.95 | 11111 | 21144 |
| 18 | 0.30 | 28 | 20 | 23.4 | 1.60 | 26 | 26.81 | 12377 | 23167 |
| 19 | 0.00 | 26 | 20 | 22.9 | 1.39 | 49 | 24.46 | 24836 | 45563 |
| 20 | 10.20 | 30 | 19 | 25.1 | 1.87 | 222 | 28.29 | 21626 | 39854 |
| 21 | 0.00 | 29 | 19 | 25.0 | 1.89 | 326 | 26.50 | 22008 | 40340 |
| 22 | 0.00 | 27 | 16 | 22.1 | 0.54 | 69 | 23.33 | 22831 | 41230 |
| 23 | 0.00 | 27 | 16 | 22.7 | 0.50 | 129 | 22.36 | 24456 | 44046 |
| 24 | 0.00 | 29 | 16 | 23.3 | 0.61 | 229 | 22.70 | 23594 | 42272 |
| 25 | 0.00 | 31 | 20 | 25.5 | 1.58 | 225 | 27.84 | 21229 | 39128 |
| 26 | 0.00 | 31 | 20 | 26.1 | 0.83 | 219 | 28.70 | 22217 | 40288 |
| 27 | 0.00 | 32 | 21 | 26.5 | 1.48 | 223 | 29.43 | 21104 | 38083 |
| 28 | 0.00 | 34 | 23 | 27.5 | 2.41 | 233 | 29.45 | 21267 | 38640 |
| 29 | 0.50 | 31 | 25 | 26.9 | 1.83 | 58 | 31.66 | 18104 | 32685 |
| 30 | 0.00 | 29 | 23 | 25.5 | 1.53 | 70 | 29.39 | 21899 | 40779 |
| 31 | 0.00 | 28 | 24 | 25.7 | 2.79 | 52 | 31.73 | 9842 | 19014 |
| Mon. Tot. Precip. 86.1 mm | Mean wind vel. 1.355 m/s |
| Mon. Mean Temp. 24.4 deg. C | Wind dir 244 deg |
| Mean Max. Temp. 29.1 deg. C | Mean Min. Temp. 19.5 deg. C |
| Extreme Max. Temp 33.6 deg. C | Mean vapor press 26.42 mb |
| Extreme Min. Temp 15.9 deg. C | Total Solar Rad 624406 KJ/sq. m |
| Total photosyn. 1143665 uEin/sq.m |
 |
| Daily Total Precipitation (mm) |

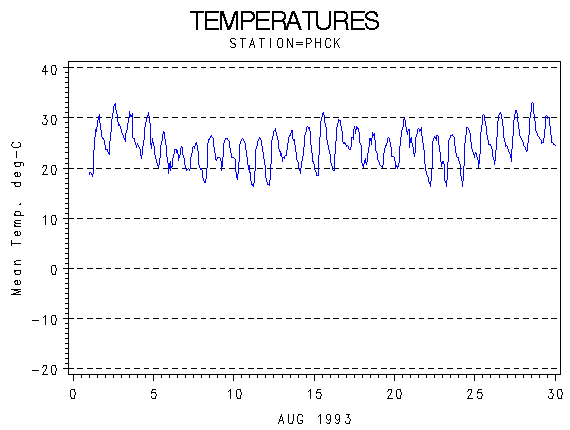 |
| Hourly Mean Temperatures (deg. C) |

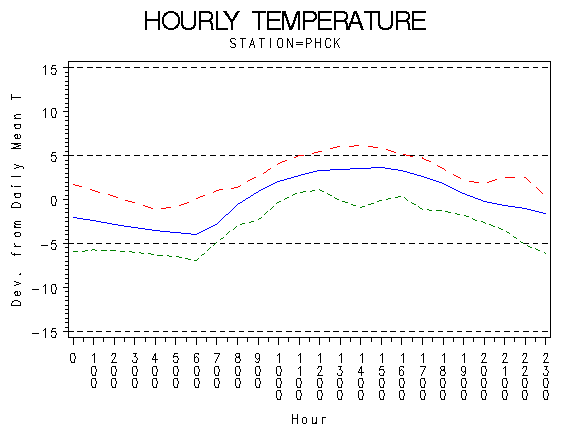 |
| Hourly Max Min and Mean Temperatures (deg. C) |

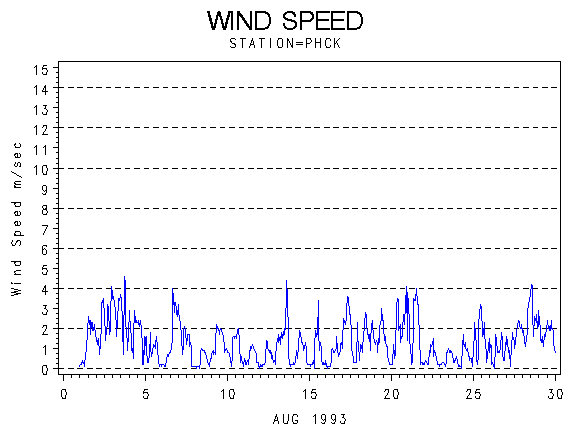 |
| Wind Speed (m/s) |

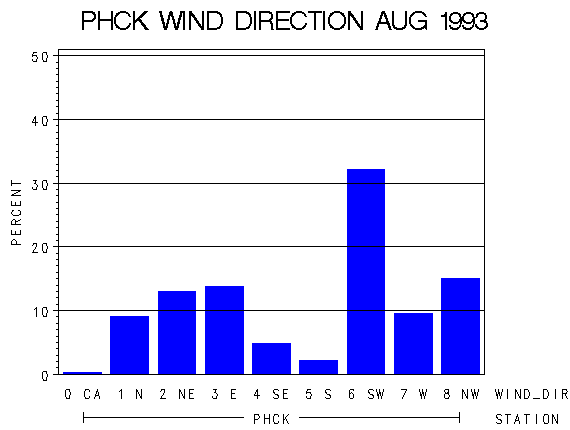 |
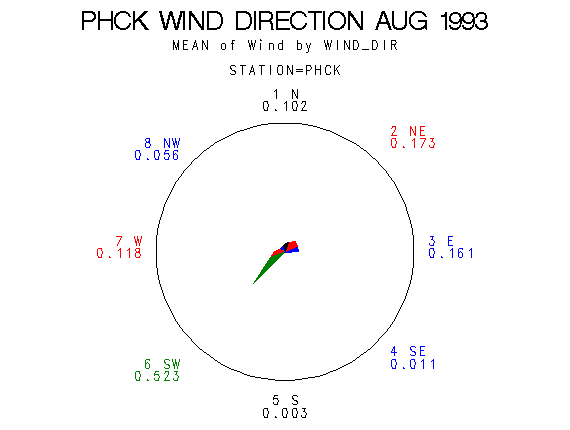
| Frequency of Wind Direction |

 |
| Wind Vectors (circle=1.5 m/s) |

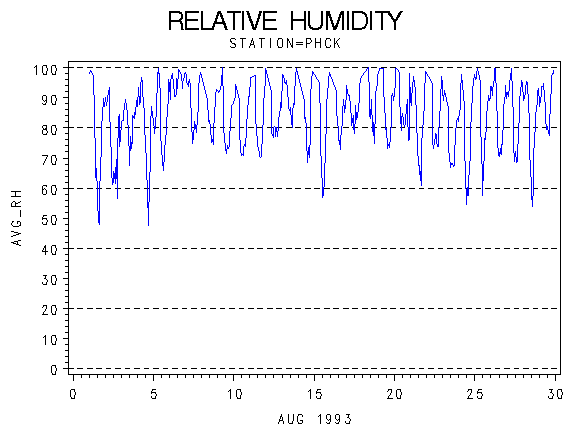 |
| Relative Humidity (percent) |

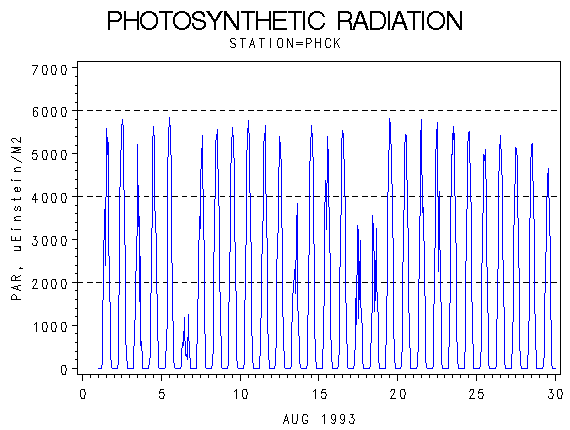 |
| Photosynthetically Active Radiation (micro-einsteins per m squared) |

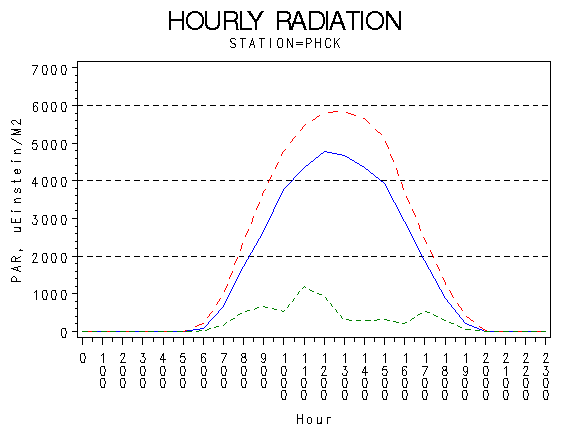 |
| Hourly Photosynthetically Active Radiation (micro-einsteins per m squared) |

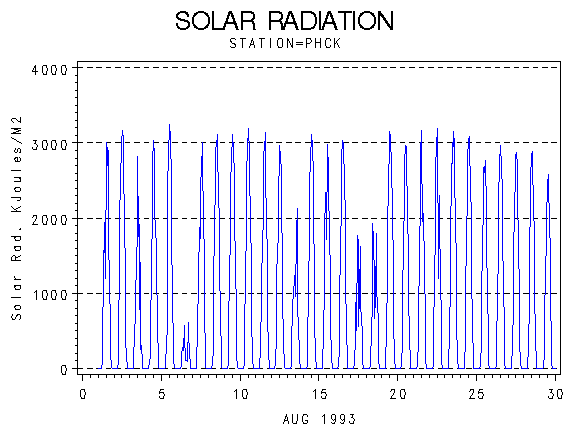 |
| Solar Radiation (KiloJoules per Meter Squared) |

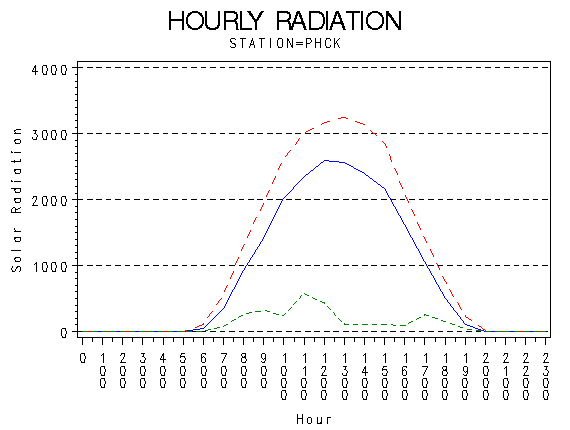 |
| Hourly Solar Radiation (KiloJoules per Meter Squared) |

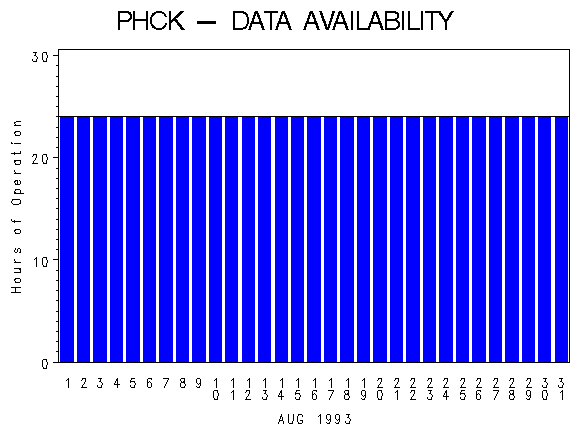 |
| Hours of Station Operation |

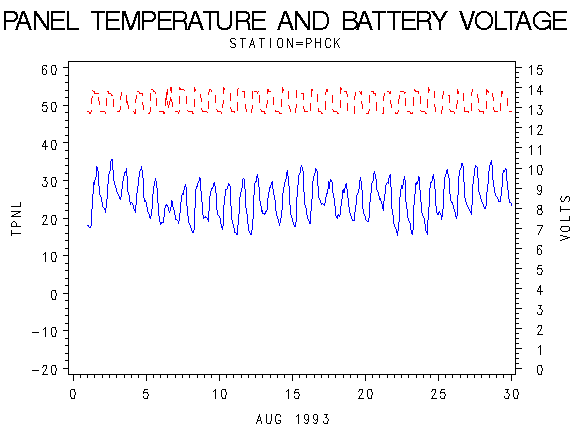 |
| Data Logger Battery Voltage and Internal Logger Temperature |
