

| VIRGINIA COAST RESERVE LONG-TERM ECOLOGICAL RESEARCH |
Site PHCK, Month NOV, Year 1992 |

| 
|
| Day of Month | Precip (mm) | Max Temp. oC | Min Temp. oC | Mean Temp. oC | Wind Speed (m/s) | Wind Dir (deg.) | Vapor Press. (mb) | Solar Rad. KJ/m2 | PAR uE/m2 |
|---|---|---|---|---|---|---|---|---|---|
| 1 | 0.00 | 13 | 9 | 11.2 | 1.48 | 42 | 13.17 | 2505 | 5140 |
| 2 | 0.00 | 17 | 13 | 15.3 | 0.91 | 94 | 16.08 | 4922 | 9898 |
| 3 | 0.00 | 21 | 8 | 16.2 | 1.61 | 342 | 15.79 | 11427 | 21017 |
| 4 | 0.00 | 20 | 7 | 14.5 | 0.97 | 215 | 17.06 | 6855 | 13486 |
| 5 | 0.00 | 21 | 9 | 16.8 | 1.65 | 332 | 19.71 | 1160 | 2694 |
| 6 | 0.00 | 11 | 7 | 8.8 | 3.08 | 349 | 8.46 | 11636 | 21646 |
| 7 | 0.00 | 10 | 6 | 7.7 | 1.26 | 0 | 7.72 | 4340 | 8272 |
| 8 | 0.00 | 9 | 3 | 5.5 | 1.68 | 5 | 6.42 | 8052 | 15190 |
| 9 | 0.00 | 9 | -2 | 3.5 | 1.29 | 31 | 5.43 | 12459 | 22719 |
| 10 | 0.00 | 13 | -1 | 6.1 | 0.70 | 56 | 8.20 | 10432 | 19529 |
| 11 | 0.00 | 20 | 4 | 11.7 | 1.03 | 218 | 12.80 | 11236 | 21374 |
| 12 | 0.00 | 18 | 10 | 15.1 | 1.09 | 207 | 15.90 | 6173 | 12199 |
| 13 | 0.00 | 19 | 0 | 11.4 | 2.81 | 314 | 10.56 | 11795 | 21453 |
| 14 | 0.00 | 9 | -0 | 3.9 | 1.06 | 344 | 6.13 | 11434 | 21018 |
| 15 | 0.00 | 10 | 1 | 4.7 | 1.78 | 356 | 5.27 | 8888 | 16630 |
| 16 | 0.00 | 6 | -4 | 1.1 | 1.10 | 351 | 4.45 | 11603 | 21057 |
| 17 | 0.00 | 13 | -4 | 5.4 | 1.97 | 229 | 6.06 | 10714 | 20360 |
| 18 | 0.00 | 18 | 3 | 11.1 | 0.73 | 276 | 9.54 | 10321 | 19047 |
| 19 | 0.00 | 13 | 6 | 10.3 | 2.27 | 50 | 12.20 | 3523 | 6958 |
| 20 | 0.00 | 13 | 9 | 10.8 | 2.93 | 63 | 10.65 | 7724 | 14545 |
| 21 | 0.00 | 20 | 11 | 14.9 | 0.93 | 128 | 14.80 | 9713 | 18907 |
| 22 | 0.00 | 21 | 14 | 16.1 | 1.50 | 216 | 17.48 | 5694 | 11394 |
| 23 | 0.00 | 25 | 14 | 18.8 | 2.88 | 252 | 17.43 | 8575 | 16538 |
| 24 | 0.00 | 15 | 8 | 12.6 | 2.14 | 56 | 12.74 | 6153 | 12163 |
| 25 | 0.00 | 16 | 13 | 14.1 | 1.54 | 323 | 16.03 | 6463 | 12929 |
| 26 | 0.00 | 19 | 14 | 15.9 | 1.39 | 222 | 18.61 | 1485 | 3287 |
| 27 | 0.00 | 19 | 6 | 10.3 | 2.38 | 6 | 11.81 | 1466 | 3257 |
| 28 | 0.00 | 12 | 7 | 8.8 | 1.65 | 348 | 9.80 | 7087 | 13241 |
| 29 | 0.00 | 10 | -0 | 5.9 | 1.27 | 343 | 7.92 | 5242 | 9854 |
| 30 | 0.00 | 8 | -2 | 2.8 | 0.76 | 288 | 6.47 | 9303 | 17154 |
| Mon. Tot. Precip. 0.0 mm | Mean wind vel. 1.594 m/s |
| Mon. Mean Temp. 10.4 deg. C | Wind dir 354 deg |
| Mean Max. Temp. 15.0 deg. C | Mean Min. Temp. 5.6 deg. C |
| Extreme Max. Temp 24.7 deg. C | Mean vapor press 11.49 mb |
| Extreme Min. Temp -4.2 deg. C | Total Solar Rad 228380 KJ/sq. m |
| Total photosyn. 432953 uEin/sq.m |
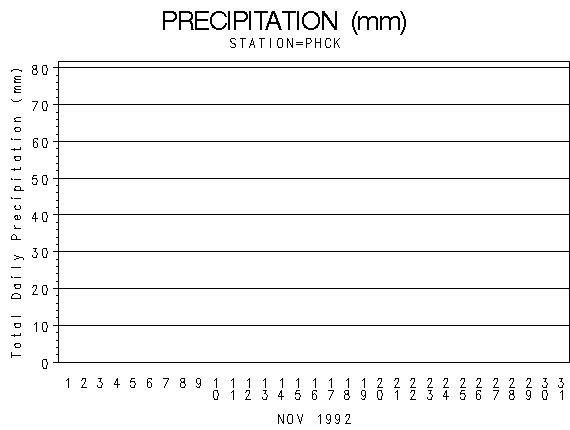 |
| Daily Total Precipitation (mm) |

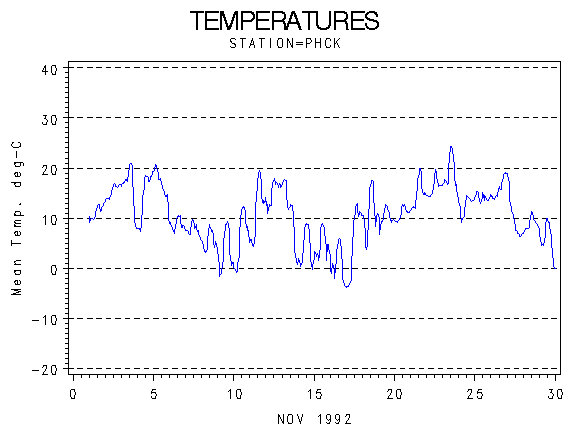 |
| Hourly Mean Temperatures (deg. C) |

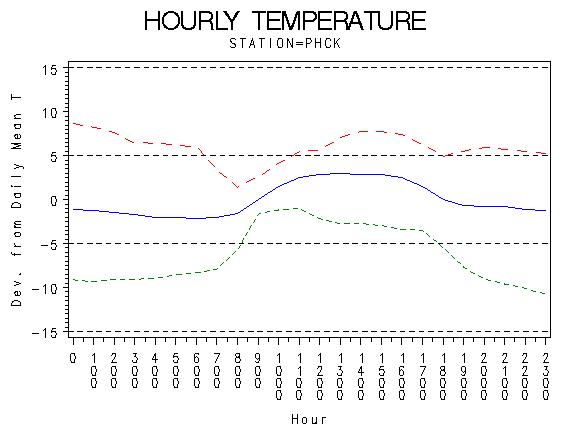 |
| Hourly Max Min and Mean Temperatures (deg. C) |

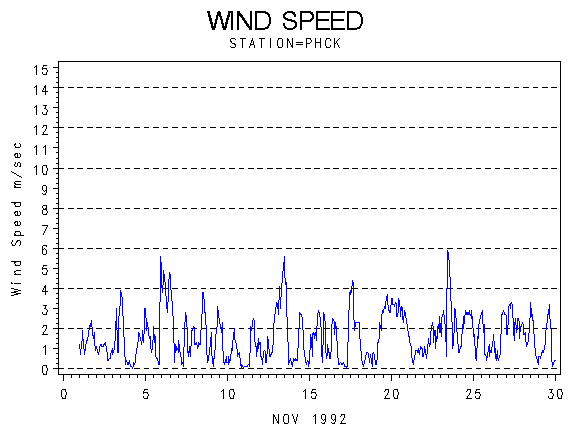 |
| Wind Speed (m/s) |

 |
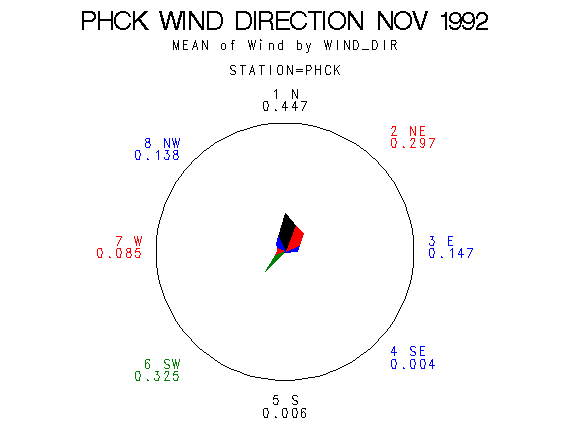
| Frequency of Wind Direction |

 |
| Wind Vectors (circle=1.5 m/s) |

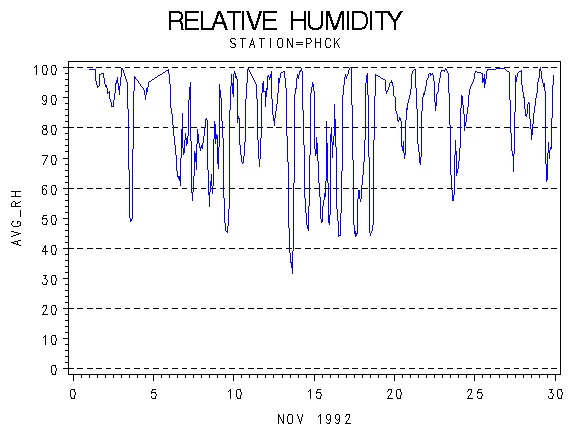 |
| Relative Humidity (percent) |

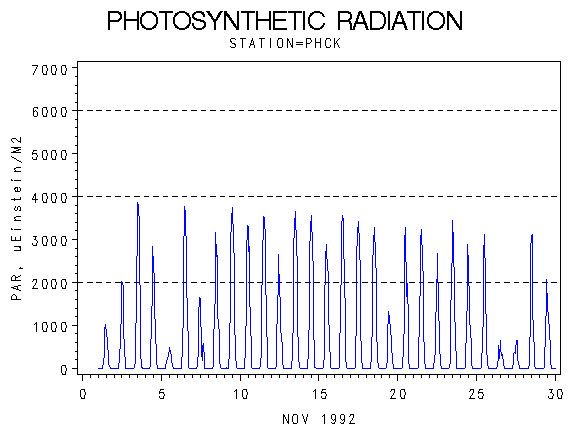 |
| Photosynthetically Active Radiation (micro-einsteins per m squared) |

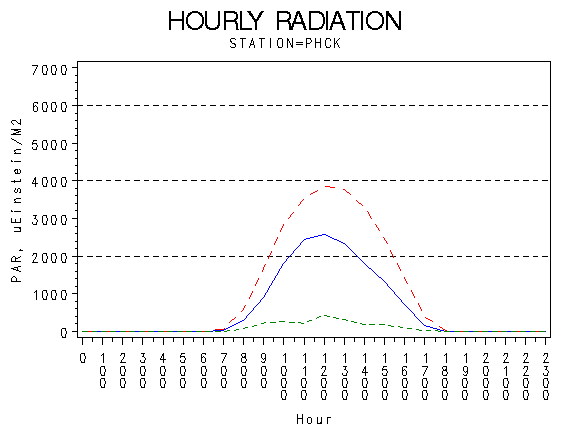 |
| Hourly Photosynthetically Active Radiation (micro-einsteins per m squared) |

 |
| Solar Radiation (KiloJoules per Meter Squared) |

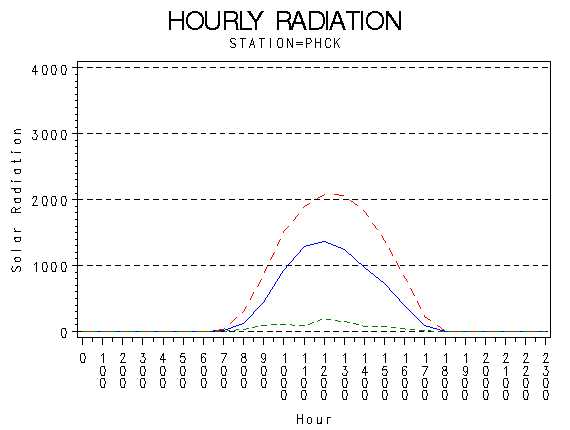 |
| Hourly Solar Radiation (KiloJoules per Meter Squared) |

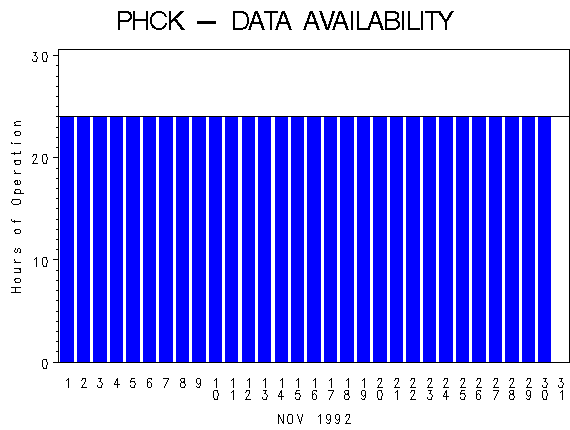 |
| Hours of Station Operation |

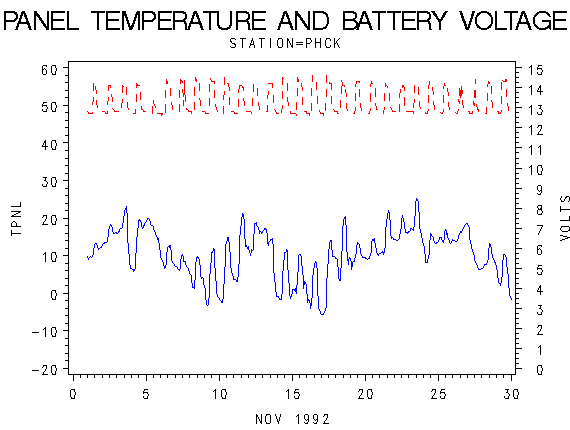 |
| Data Logger Battery Voltage and Internal Logger Temperature |
