
|
| VIRGINIA COAST RESERVE LONG-TERM ECOLOGICAL RESEARCH |
Site OYSM, Month JUL, Year 2016 |

| 
|
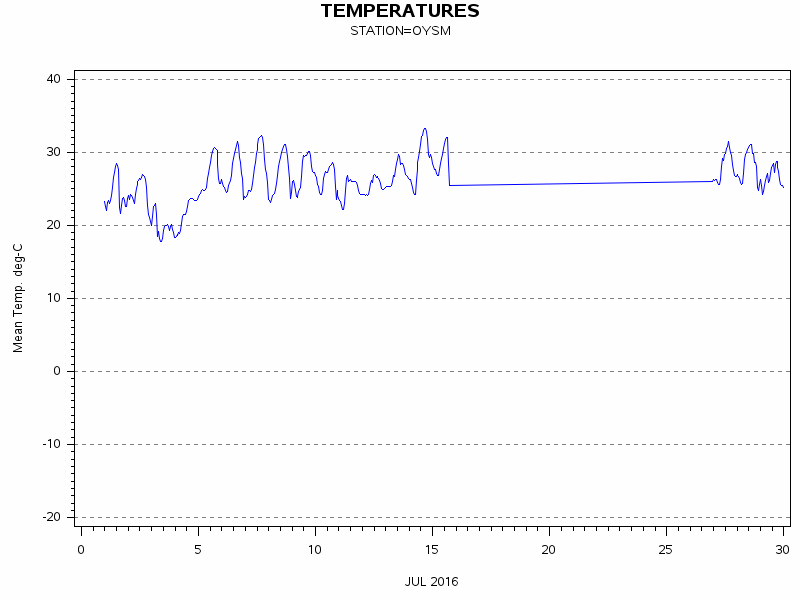
| Day of Month | Precip (mm) | Max Temp. oC | Min Temp. oC | Mean Temp. oC | Wind Speed (m/s) | Wind Dir (deg.) | Vapor Press. (mb) | Solar Rad. KJ/m2 | PAR mMoles/m2 |
|---|---|---|---|---|---|---|---|---|---|
| 1 | 5.33 | 29 | 21 | 24.3 | 1.73 | 192 | 21.86 | 18608 | 36717 |
| 2 | 0.00 | 27 | 20 | 24.6 | 2.19 | 317 | 20.51 | 27628 | 53747 |
| 3 | 0.00 | 23 | 17 | 19.8 | 2.53 | 41 | 20.98 | 4386 | 9288 |
| 4 | 0.00 | 24 | 18 | 21.5 | 1.65 | 126 | 18.51 | 7094 | 14128 |
| 5 | 0.00 | 31 | 24 | 27.1 | 2.12 | 234 | 19.35 | 23638 | 46577 |
| 6 | 7.62 | 32 | 23 | 27.1 | 1.44 | 258 | 19.95 | 23917 | 47402 |
| 7 | 0.00 | 33 | 24 | 28.0 | 1.44 | 227 | 20.46 | 26819 | 52671 |
| 8 | 0.00 | 31 | 23 | 26.9 | 2.02 | 251 | 19.99 | 25822 | 50716 |
| 9 | 0.00 | 31 | 24 | 27.1 | 1.82 | 253 | 20.42 | 22584 | 45432 |
| 10 | 0.00 | 29 | 23 | 26.3 | 2.42 | 281 | 22.11 | 27153 | 53542 |
| 11 | 0.00 | 27 | 22 | 24.8 | 1.48 | 55 | 22.32 | 27454 | 54553 |
| 12 | 0.00 | 27 | 24 | 25.4 | 2.53 | 33 | 21.22 | 25294 | 51100 |
| 13 | 0.00 | 30 | 25 | 27.0 | 2.61 | 130 | 19.87 | 25032 | 51698 |
| 14 | 0.00 | 34 | 24 | 29.0 | 1.08 | 204 | 21.65 | 26709 | 53836 |
| 15 | 1.52 | 33 | 24 | 28.8 | 1.71 | 202 | 22.00 | 21521 | 43480 |
| 26 | 0.00 | 26 | 26 | 26.0 | 0.20 | 217 | 19.68 | 2 | 0 |
| 27 | 0.00 | 32 | 25 | 28.0 | 0.84 | 218 | 19.39 | 21480 | 43239 |
| 28 | 0.00 | 32 | 24 | 28.1 | 1.64 | 125 | 19.45 | 24115 | 49141 |
| 29 | 0.51 | 29 | 24 | 26.7 | 2.16 | 284 | 18.81 | 20281 | 41658 |
| 30 | 0.00 | 29 | 23 | 25.6 | 1.40 | 130 | 18.20 | 14692 | 30136 |
| 31 | 0.00 | 31 | 22 | 25.7 | 1.54 | 184 | 16.75 | 19715 | 40857 |
| Mon. Tot. Precip. 15.0 mm | Mean wind vel. 1.741 m/s |
| Mon. Mean Temp. 26.1 deg. C | Wind dir 221 deg |
| Mean Max. Temp. 29.5 deg. C | Mean Min. Temp. 22.8 deg. C |
| Extreme Max. Temp 33.7 deg. C | Mean vapor press 20.17 mb |
| Extreme Min. Temp 17.5 deg. C | Total Solar Rad 433944 KJ/sq. m |
| Total photosyn. 869917 mMoles/sq.m |
 |
| Daily Total Precipitation (mm) |

 |
| Hourly Mean Temperatures (deg. C) |
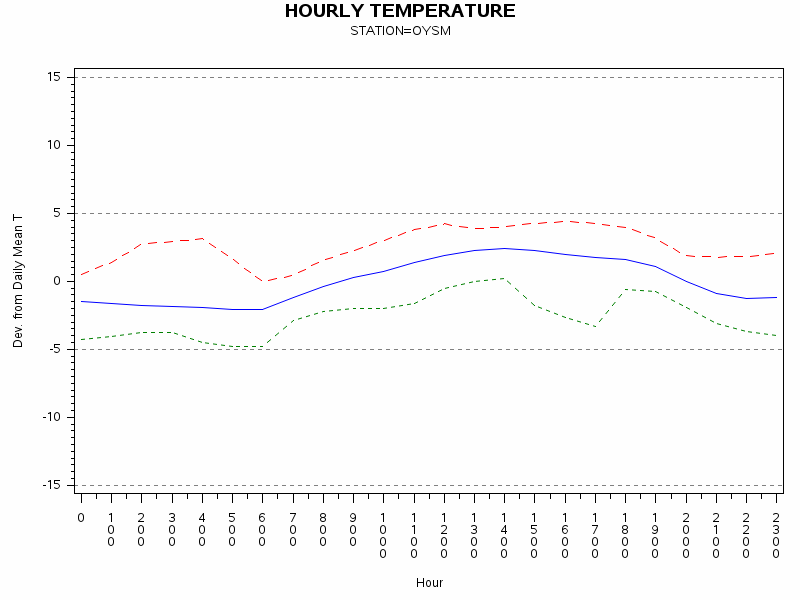 |
| Hourly Max Min and Mean Temperatures (deg. C) |
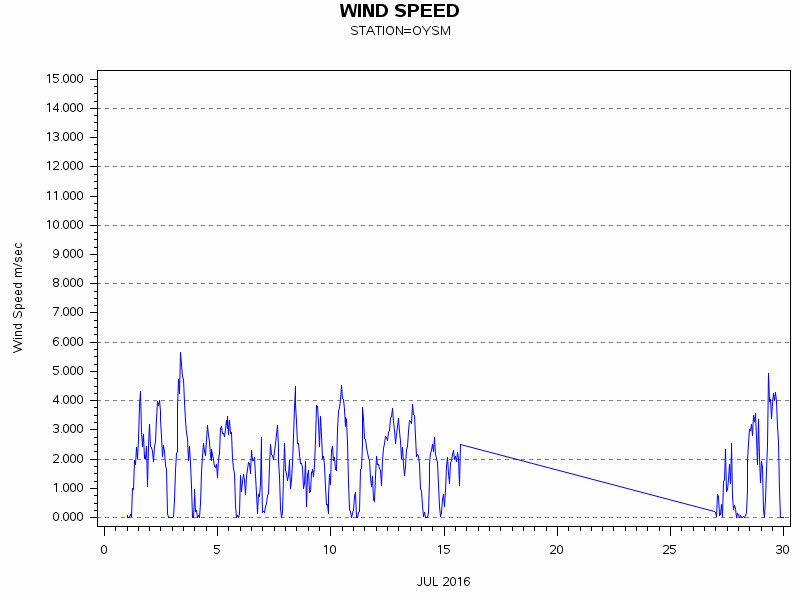 |
| Wind Speed (m/s) |
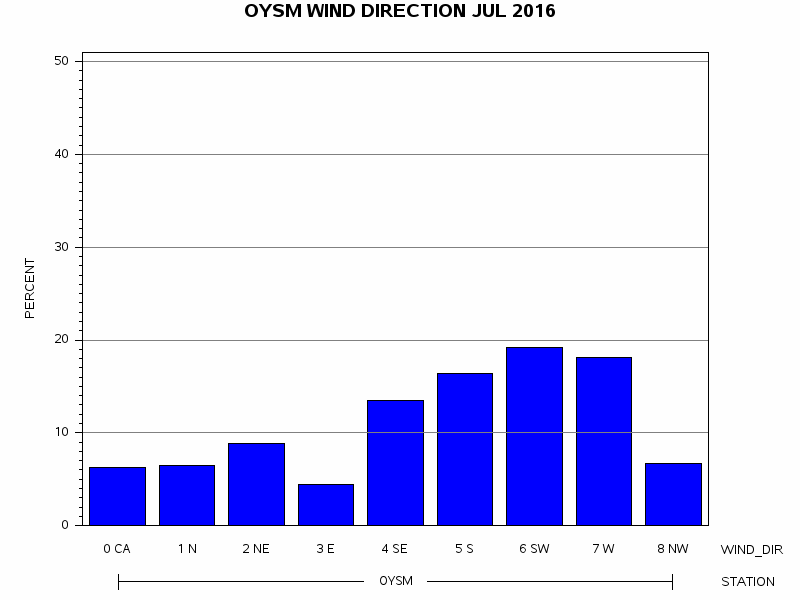 |
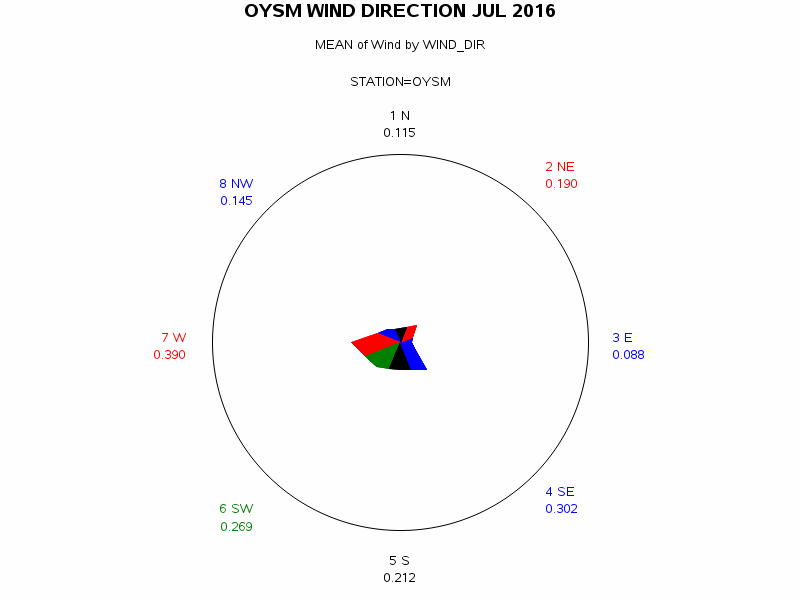
| Frequency of Wind Direction |
 |
| Wind Vectors (circle=1.5 m/s) |
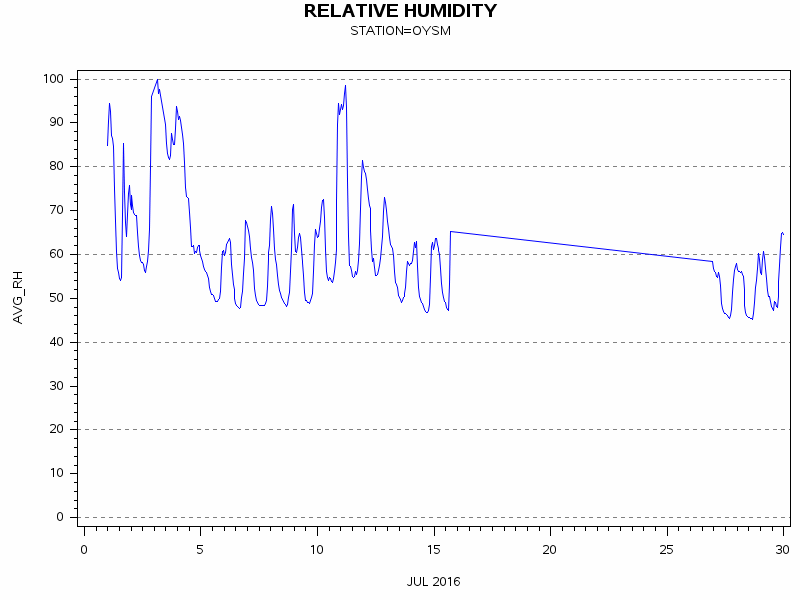 |
| Relative Humidity (percent) |
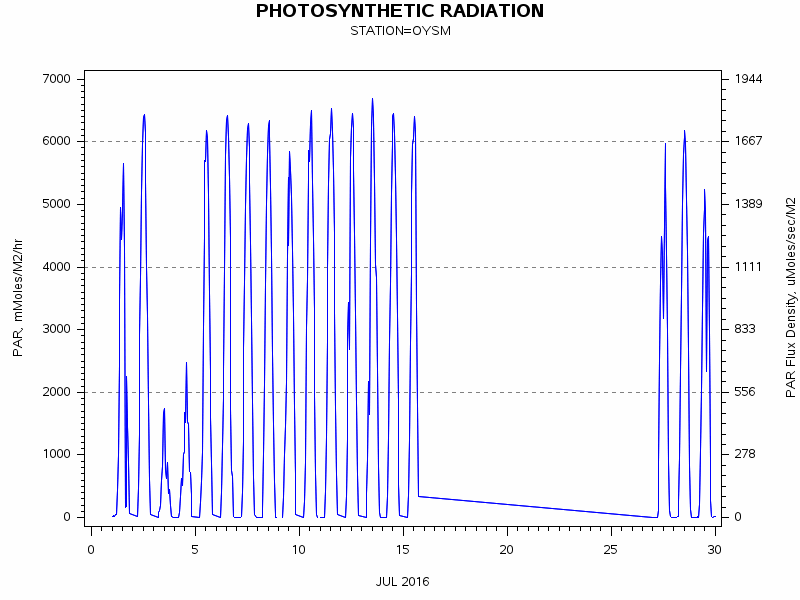 |
| Photosynthetically Active Radiation (milli-moles per m squared) |
 |
| Hourly Photosynthetically Active Radiation (milliMoles per m squared) |
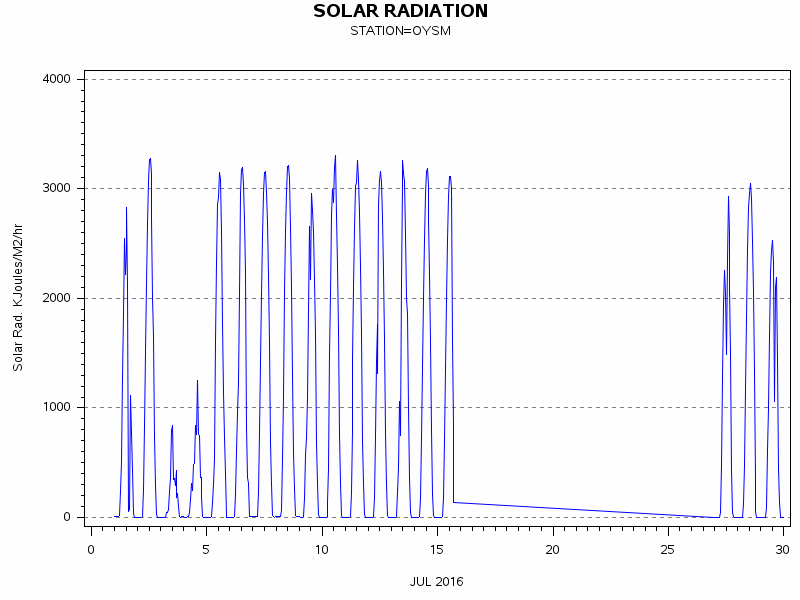 |
| Solar Radiation (KiloJoules per Meter Squared) |
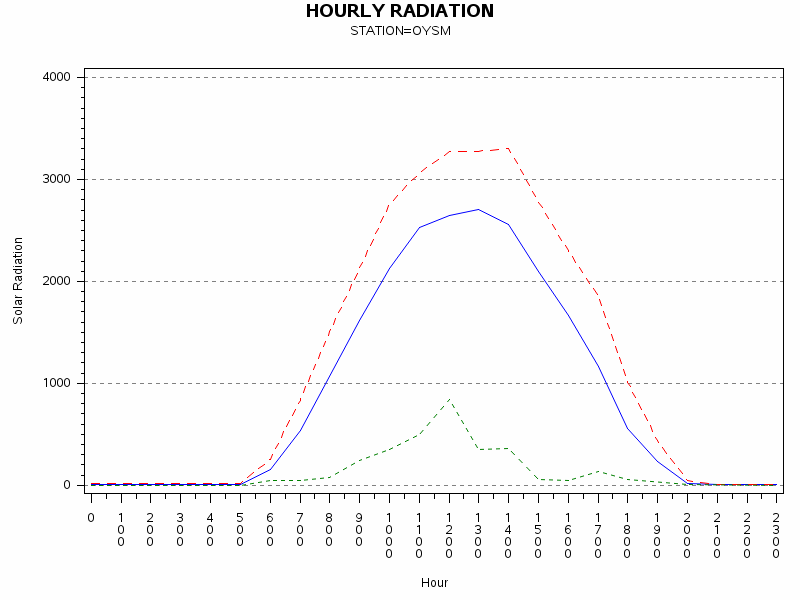 |
| Hourly Solar Radiation (KiloJoules per Meter Squared) |
 |
| Hours of Station Operation |
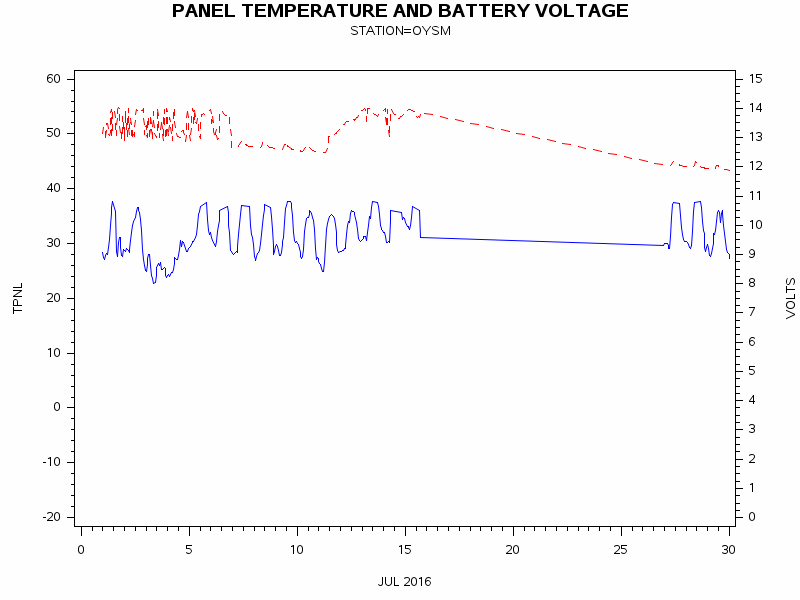 |
| Data Logger Battery Voltage and Internal Logger Temperature |