
|
| VIRGINIA COAST RESERVE LONG-TERM ECOLOGICAL RESEARCH |
Site OYSM, Month AUG, Year 2012 |

| 
|
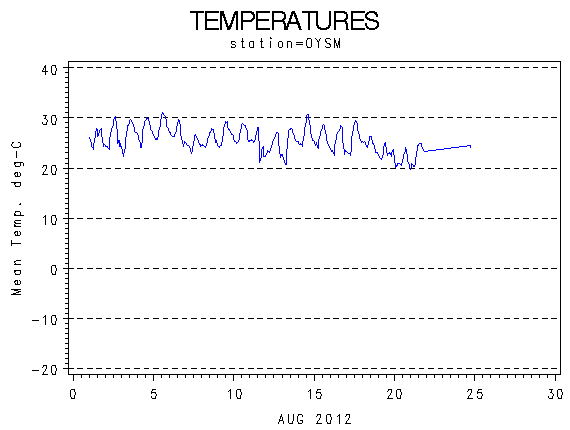
| Day of Month | Precip (mm) | Max Temp. oC | Min Temp. oC | Mean Temp. oC | Wind Speed (m/s) | Wind Dir (deg.) | Vapor Press. (mb) | Solar Rad. KJ/m2 | PAR mMoles/m2 |
|---|---|---|---|---|---|---|---|---|---|
| 1 | 0.25 | 29 | 23 | 25.9 | 0.73 | 232 | 26.58 | 16060 | 34311 |
| 2 | 0.00 | 31 | 23 | 26.4 | 1.30 | 174 | 27.22 | 23595 | 49010 |
| 3 | 0.00 | 30 | 22 | 26.7 | 2.01 | 160 | 28.32 | 24412 | 51332 |
| 4 | 0.00 | 30 | 24 | 27.5 | 2.03 | 166 | 29.47 | 25046 | 53197 |
| 5 | 0.00 | 32 | 26 | 28.2 | 2.46 | 205 | 28.52 | 23611 | 51499 |
| 6 | 0.00 | 30 | 24 | 26.9 | 2.31 | 240 | 27.40 | 16841 | 36937 |
| 7 | 0.00 | 27 | 23 | 24.8 | 1.13 | 196 | 28.14 | 8112 | 17926 |
| 8 | 0.00 | 28 | 24 | 25.8 | 0.96 | 221 | 29.70 | 11111 | 24072 |
| 9 | 0.00 | 30 | 24 | 26.7 | 1.71 | 173 | 29.50 | 22781 | 46798 |
| 10 | 0.00 | 29 | 25 | 26.7 | 2.82 | 216 | 28.07 | 14942 | 32590 |
| 11 | 0.00 | 29 | 20 | 24.7 | 2.50 | 222 | 27.33 | 8482 | 18436 |
| 12 | 0.00 | 28 | 22 | 24.4 | 1.04 | 274 | 25.75 | 17003 | 35587 |
| 13 | 0.00 | 28 | 21 | 24.9 | 1.57 | 128 | 24.46 | 24511 | 49848 |
| 14 | 0.00 | 31 | 24 | 26.9 | 1.64 | 191 | 26.50 | 23528 | 47775 |
| 15 | 0.00 | 29 | 24 | 26.0 | 1.06 | 260 | 27.06 | 16461 | 34328 |
| 16 | 0.00 | 29 | 22 | 25.3 | 1.65 | 316 | 23.21 | 22778 | 48431 |
| 17 | 0.00 | 30 | 22 | 25.9 | 1.85 | 188 | 24.92 | 22116 | 47281 |
| 18 | 0.00 | 27 | 23 | 24.7 | 2.29 | 25 | 24.79 | 16622 | 34980 |
| 19 | 0.00 | 25 | 21 | 23.0 | 2.33 | 75 | 22.90 | 7767 | 16540 |
| 20 | 0.00 | 25 | 20 | 21.4 | 2.29 | 45 | 22.73 | 10311 | 22923 |
| 21 | 1.78 | 25 | 19 | 22.6 | 0.68 | 128 | 23.78 | 7853 | 27797 |
| 24 | 0.00 | 25 | 24 | 24.3 | 2.89 | 62 | 22.05 | 408 | 970 |
| Mon. Tot. Precip. 2.0 mm | Mean wind vel. 1.784 m/s |
| Mon. Mean Temp. 25.4 deg. C | Wind dir 181 deg |
| Mean Max. Temp. 28.5 deg. C | Mean Min. Temp. 22.7 deg. C |
| Extreme Max. Temp 31.6 deg. C | Mean vapor press 26.29 mb |
| Extreme Min. Temp 19.4 deg. C | Total Solar Rad 364351 KJ/sq. m |
| Total photosyn. 782570 mMoles/sq.m |
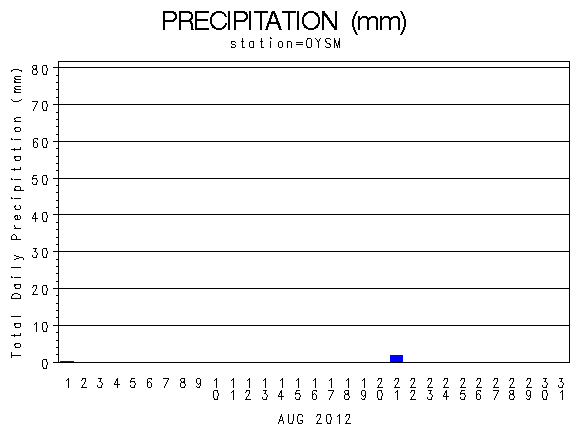 |
| Daily Total Precipitation (mm) |

 |
| Hourly Mean Temperatures (deg. C) |
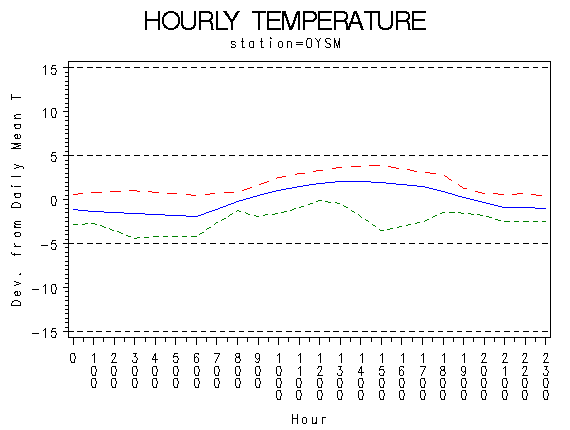 |
| Hourly Max Min and Mean Temperatures (deg. C) |
 |
| Wind Speed (m/s) |
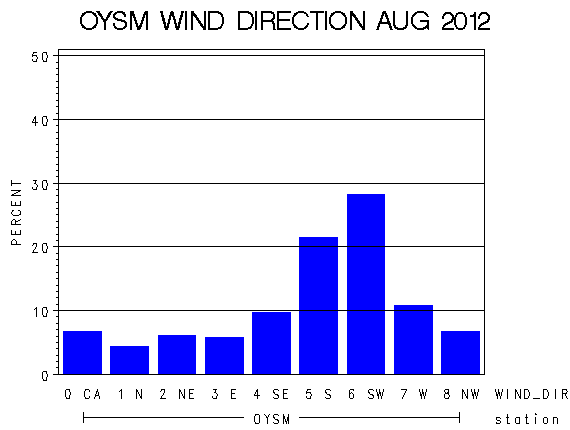 |
| Frequency of Wind Direction |
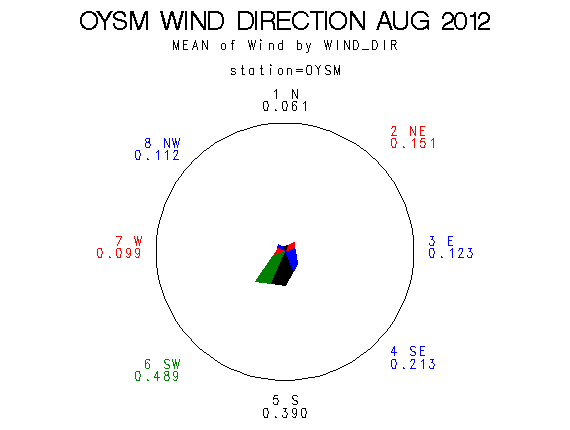 |
| Wind Vectors (circle=1.5 m/s) |
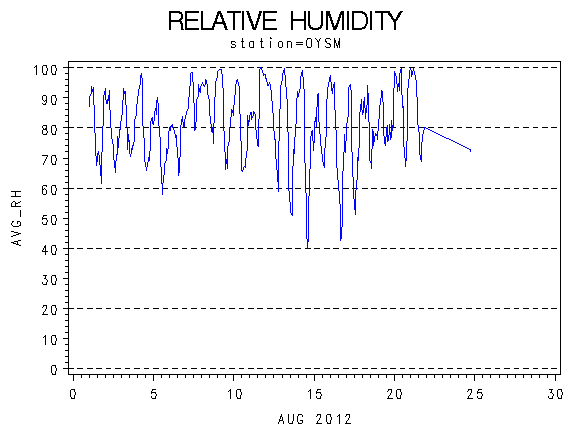 |
| Relative Humidity (percent) |
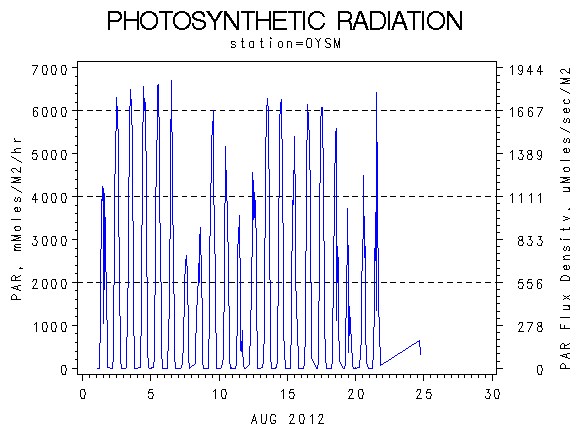 |
| Photosynthetically Active Radiation (milli-moles per m squared) |
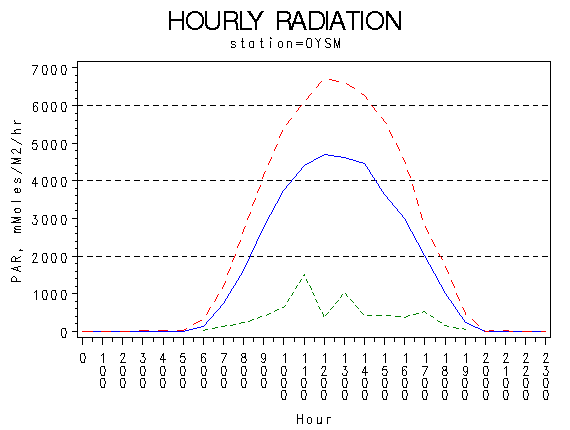 |
| Hourly Photosynthetically Active Radiation (milliMoles per m squared) |
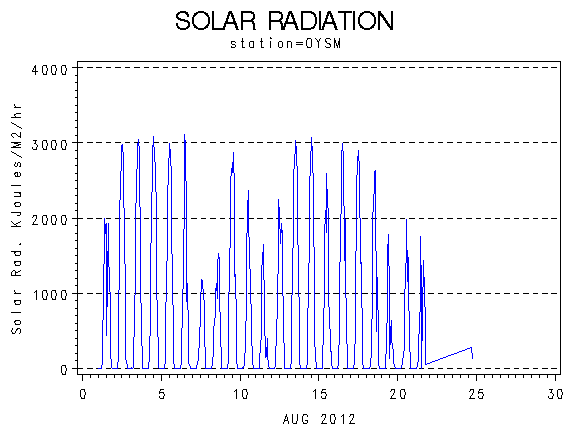 |
| Solar Radiation (KiloJoules per Meter Squared) |
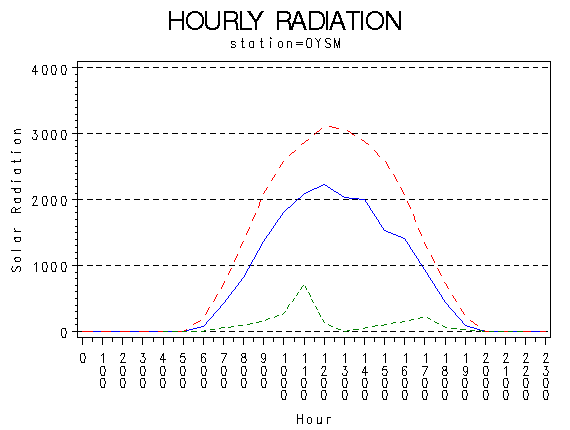 |
| Hourly Solar Radiation (KiloJoules per Meter Squared) |
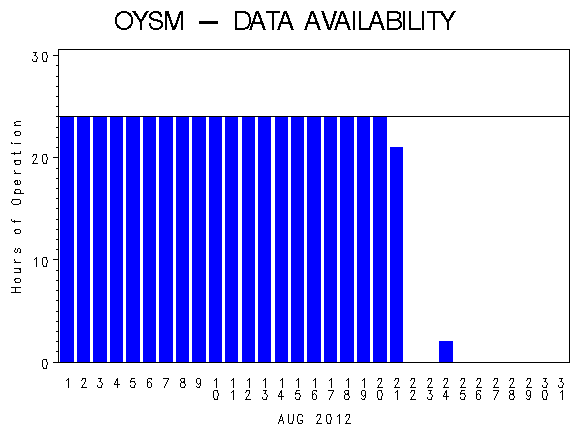 |
| Hours of Station Operation |
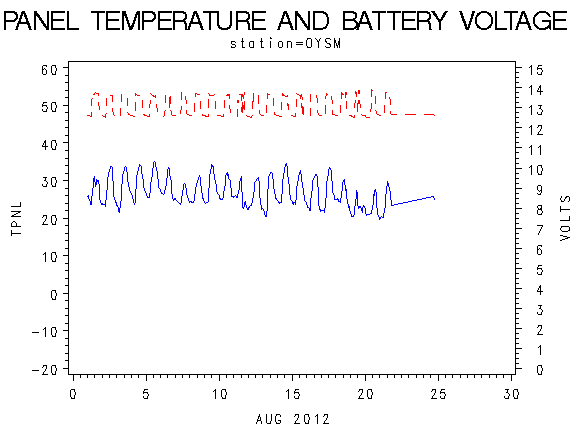 |
| Data Logger Battery Voltage and Internal Logger Temperature |