
|
| VIRGINIA COAST RESERVE LONG-TERM ECOLOGICAL RESEARCH |
Site OYSM, Month JUL, Year 1999 |

| 
|
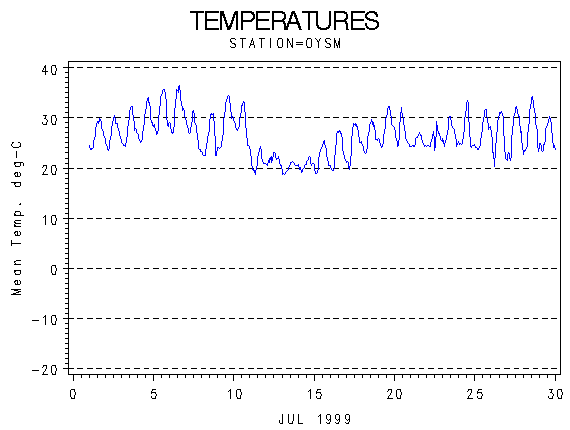
| Day of Month | Precip (mm) | Max Temp. oC | Min Temp. oC | Mean Temp. oC | Wind Speed (m/s) | Wind Dir (deg.) | Vapor Press. (mb) | Solar Rad. KJ/m2 | PAR uE/m2 |
|---|---|---|---|---|---|---|---|---|---|
| 1 | 0.00 | 31 | 24 | 26.7 | 3.48 | 208 | 28.25 | . | . |
| 2 | 0.00 | 31 | 23 | 27.0 | 3.02 | 213 | 29.14 | . | . |
| 3 | 0.00 | 33 | 24 | 27.7 | 2.51 | 241 | 30.35 | . | . |
| 4 | 0.00 | 34 | 25 | 29.2 | 2.48 | 265 | 31.67 | . | . |
| 5 | 0.00 | 36 | 26 | 31.0 | 2.46 | 297 | 33.00 | . | . |
| 6 | 0.00 | 37 | 26 | 31.6 | 2.05 | 243 | 34.82 | . | . |
| 7 | 5.08 | 33 | 23 | 27.6 | 3.46 | 263 | 30.63 | . | . |
| 8 | 0.25 | 31 | 22 | 26.0 | 1.94 | 304 | 26.03 | . | . |
| 9 | 0.00 | 35 | 24 | 29.3 | 2.25 | 248 | 30.17 | . | . |
| 10 | 2.79 | 34 | 24 | 28.9 | 3.53 | 275 | 30.09 | . | . |
| 11 | 15.24 | 25 | 18 | 21.4 | 2.35 | 60 | 19.37 | . | . |
| 12 | 1.52 | 23 | 20 | 21.6 | 3.14 | 75 | 21.73 | . | . |
| 13 | 7.87 | 22 | 18 | 20.1 | 3.37 | 50 | 22.10 | . | . |
| 14 | 26.67 | 23 | 19 | 20.7 | 2.66 | 62 | 23.08 | . | . |
| 15 | 0.00 | 26 | 19 | 22.1 | 1.59 | 155 | 23.65 | . | . |
| 16 | 0.00 | 28 | 19 | 23.5 | 1.63 | 167 | 25.74 | . | . |
| 17 | 0.00 | 30 | 19 | 25.1 | 1.93 | 190 | 28.61 | . | . |
| 18 | 0.00 | 30 | 23 | 26.2 | 1.70 | 197 | 30.77 | . | . |
| 19 | 0.00 | 33 | 24 | 28.1 | 2.54 | 274 | 31.04 | . | . |
| 20 | 0.00 | 33 | 24 | 27.0 | 2.51 | 103 | 31.84 | . | . |
| 21 | 0.00 | 28 | 24 | 25.3 | 3.08 | 118 | 29.65 | . | . |
| 22 | 8.13 | 30 | 23 | 25.7 | 1.42 | 165 | 31.50 | . | . |
| 23 | 0.00 | 31 | 24 | 26.9 | 1.89 | 109 | 33.00 | . | . |
| 24 | 0.76 | 34 | 24 | 27.1 | 2.36 | 224 | 32.45 | . | . |
| 25 | 0.00 | 32 | 23 | 27.2 | 2.77 | 279 | 30.93 | . | . |
| 26 | 0.00 | 32 | 20 | 26.6 | 1.93 | 318 | 26.64 | . | . |
| 27 | 0.00 | 33 | 21 | 27.1 | 1.84 | 307 | 27.84 | . | . |
| 28 | 0.76 | 35 | 23 | 28.1 | 1.92 | 290 | 29.52 | . | . |
| 29 | 0.00 | 31 | 23 | 26.4 | 2.05 | 292 | 28.98 | . | . |
| 30 | 0.00 | 35 | 22 | 28.7 | 1.81 | 259 | 29.68 | . | . |
| 31 | 0.00 | 36 | 24 | 29.5 | 1.90 | 195 | 35.60 | . | . |
| Mon. Tot. Precip. 69.1 mm | Mean wind vel. 2.373 m/s |
| Mon. Mean Temp. 26.4 deg. C | Wind dir 245 deg |
| Mean Max. Temp. 31.0 deg. C | Mean Min. Temp. 22.4 deg. C |
| Extreme Max. Temp 36.9 deg. C | Mean vapor press 28.96 mb |
| Extreme Min. Temp 18.1 deg. C | Total Solar Rad . KJ/sq. m |
| Total photosyn. . uEin/sq.m |
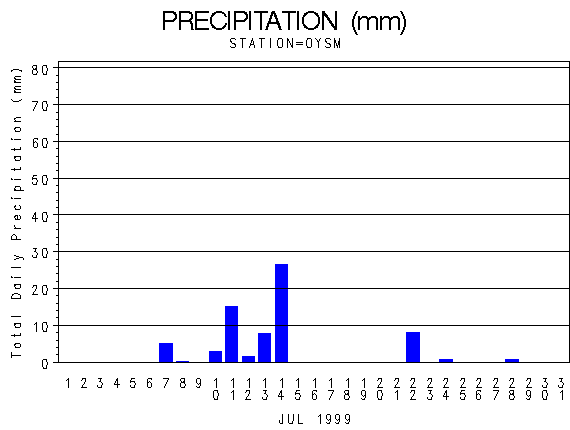 |
| Daily Total Precipitation (mm) |

 |
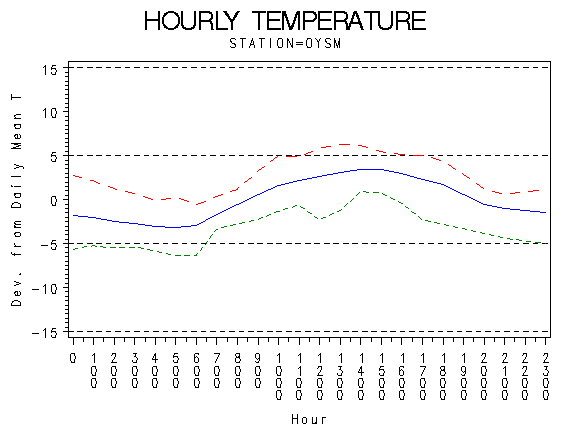
| Hourly Mean Temperatures (deg. C) |
 |
| Hourly Max Min and Mean Temperatures (deg. C) |
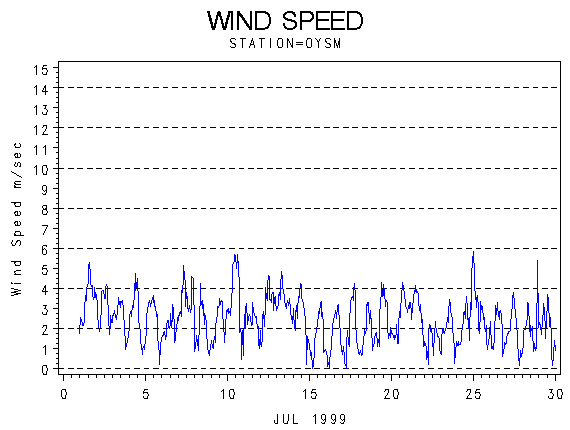 |
| Wind Speed (m/s) |
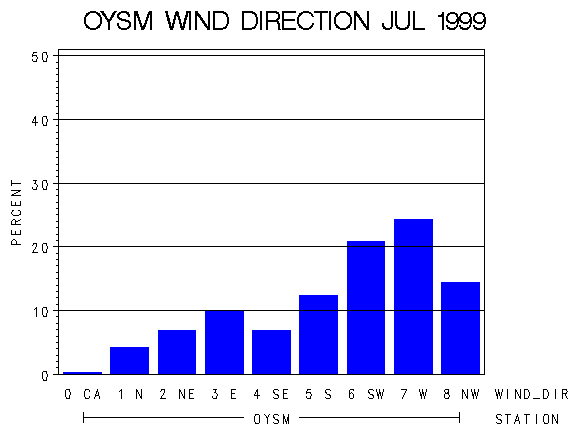 |
| Frequency of Wind Direction |
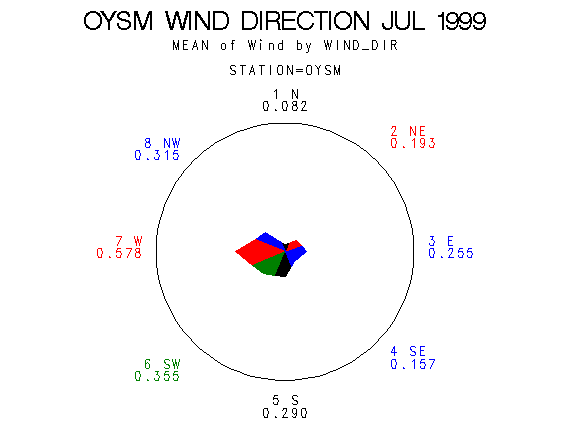 |
| Wind Vectors (circle=1.5 m/s) |
 |
| Relative Humidity (percent) |
 |
| Photosynthetically Active Radiation (micro-einsteins per m squared) |
 |
| Hourly Photosynthetically Active Radiation (micro-einsteins per m squared) |
 |
| Solar Radiation (KiloJoules per Meter Squared) |
 |
| Hourly Solar Radiation (KiloJoules per Meter Squared) |
 |
| Hours of Station Operation |
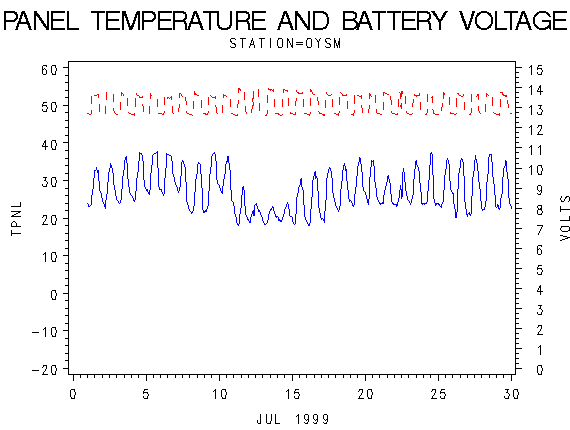 |
| Data Logger Battery Voltage and Internal Logger Temperature |