
|
| VIRGINIA COAST RESERVE LONG-TERM ECOLOGICAL RESEARCH |
Site HOGI, Month FEB, Year 2010 |

| 
|
| Day of Month | Precip (mm) | Max Temp. oC | Min Temp. oC | Mean Temp. oC | Wind Speed (m/s) | Wind Dir (deg.) | Vapor Press. (mb) | Solar Rad. KJ/m2 | PAR mMoles/m2 |
|---|---|---|---|---|---|---|---|---|---|
| 1 | 0.00 | 6 | -6 | -0.2 | 0.18 | 118 | 4.34 | 584 | 11884 |
| 2 | 0.00 | 5 | -5 | 1.7 | 0.70 | 308 | 6.15 | 623 | 4836 |
| 3 | 0.00 | 4 | 1 | 2.4 | 3.10 | 20 | 6.50 | 606 | 9671 |
| 4 | 0.00 | 4 | 0 | 2.3 | 1.86 | 23 | 4.65 | 602 | 10091 |
| 5 | 0.00 | 5 | 0 | 2.4 | 1.99 | 303 | 6.26 | 627 | 4325 |
| 6 | 0.00 | 6 | -4 | 1.8 | 7.19 | 342 | 6.85 | 639 | 2956 |
| 7 | 0.00 | 1 | -5 | -2.2 | 3.43 | 26 | 4.04 | 580 | 13084 |
| 8 | 0.00 | 2 | -3 | -0.7 | 2.93 | 41 | 3.83 | 586 | 12792 |
| 9 | 0.00 | 4 | -4 | 0.7 | 1.26 | 305 | 5.06 | 605 | 8627 |
| 10 | 0.00 | 4 | -2 | 0.6 | 6.06 | 64 | 5.76 | 628 | 5375 |
| 11 | 0.00 | 5 | -1 | 1.8 | 5.93 | 46 | 4.48 | 592 | 13293 |
| 12 | 0.00 | 4 | -1 | 1.1 | 2.15 | 35 | 4.32 | 597 | 11566 |
| 13 | 0.00 | 2 | -1 | 0.3 | 3.42 | 34 | 4.23 | 612 | 8135 |
| 14 | 0.00 | 6 | -1 | 1.5 | 2.54 | 86 | 4.00 | 582 | 13539 |
| 15 | 0.00 | 7 | -3 | 2.8 | 0.66 | 193 | 6.14 | 608 | 10126 |
| 16 | 0.00 | 5 | -0 | 2.1 | 4.24 | 83 | 4.34 | 596 | 12501 |
| 17 | 0.00 | 5 | -1 | 1.8 | 2.46 | 80 | 4.06 | 601 | 10784 |
| 18 | 0.00 | 9 | 0 | 3.8 | 2.96 | 74 | 4.84 | 592 | 13477 |
| 19 | 0.00 | 9 | 1 | 4.5 | 2.56 | 72 | 5.05 | 591 | 13873 |
| 20 | 0.00 | 7 | 2 | 3.4 | 2.48 | 47 | 4.68 | 499 | 7046 |
| Mon. Tot. Precip. 0.0 mm | Mean wind vel. 2.906 m/s |
| Mon. Mean Temp. 1.6 deg. C | Wind dir 42 deg |
| Mean Max. Temp. 5.1 deg. C | Mean Min. Temp. -1.7 deg. C |
| Extreme Max. Temp 9.3 deg. C | Mean vapor press 4.98 mb |
| Extreme Min. Temp -6.0 deg. C | Total Solar Rad 11948 KJ/sq. m |
| Total photosyn. 197982 mMoles/sq.m |
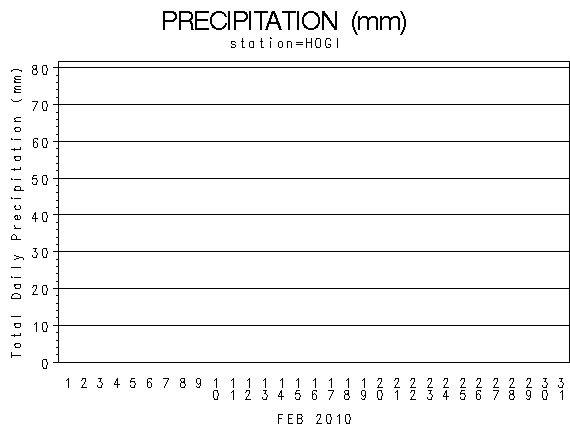 |
| Daily Total Precipitation (mm) |

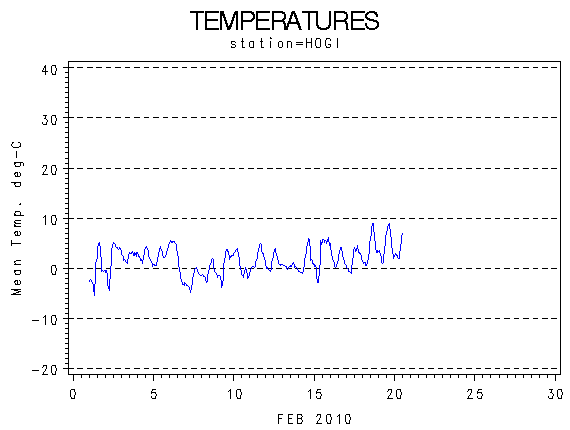 |
| Hourly Mean Temperatures (deg. C) |
 |
| Hourly Max Min and Mean Temperatures (deg. C) |
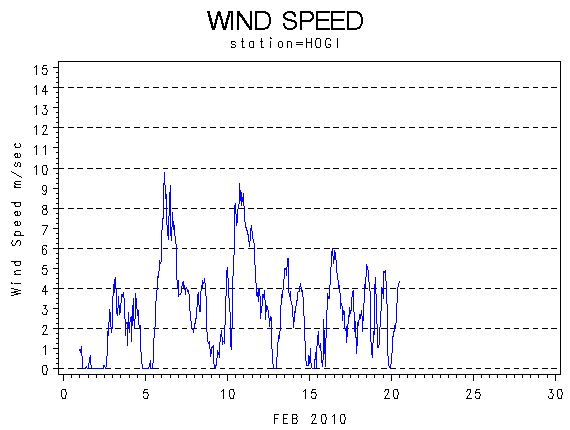 |
| Wind Speed (m/s) |
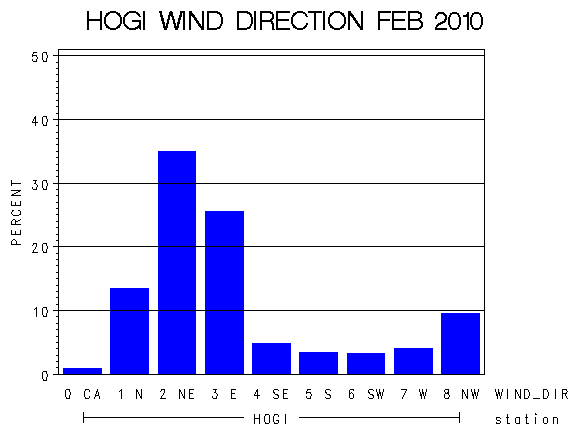 |
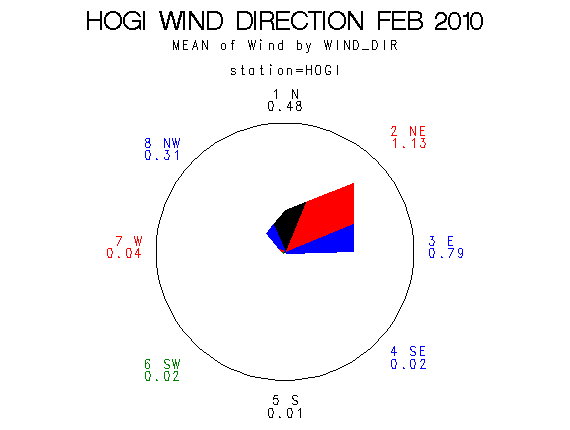
| Frequency of Wind Direction |
 |
| Wind Vectors (circle=1.5 m/s) |
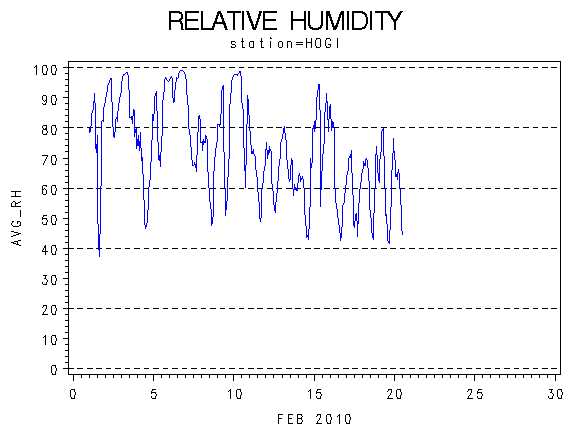 |
| Relative Humidity (percent) |
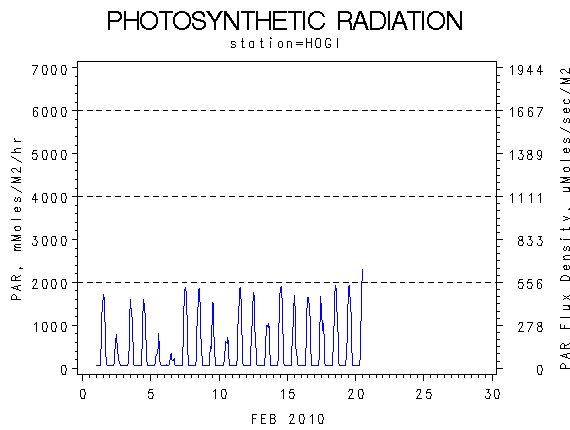 |
| Photosynthetically Active Radiation (milli-moles per m squared) |
 |
| Hourly Photosynthetically Active Radiation (milliMoles per m squared) |
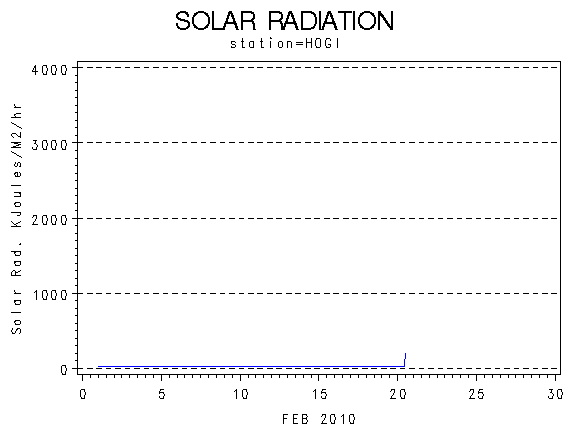 |
| Solar Radiation (KiloJoules per Meter Squared) |
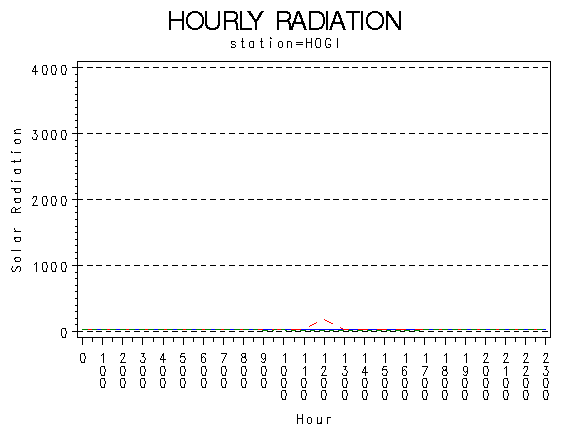 |
| Hourly Solar Radiation (KiloJoules per Meter Squared) |
 |
| Hours of Station Operation |
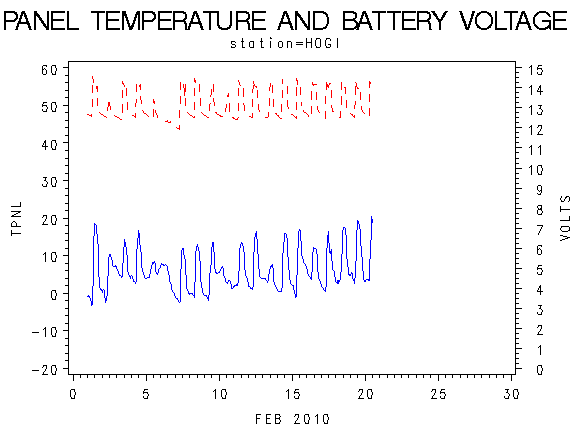 |
| Data Logger Battery Voltage and Internal Logger Temperature |