

| VIRGINIA COAST RESERVE LONG-TERM ECOLOGICAL RESEARCH |
Site HOGI, Month JAN, Year 2007 |

| 
|
| Day of Month | Precip (mm) | Max Temp. oC | Min Temp. oC | Mean Temp. oC | Wind Speed (m/s) | Wind Dir (deg.) | Vapor Press. (mb) | Solar Rad. KJ/m2 | PAR mMoles/m2 |
|---|---|---|---|---|---|---|---|---|---|
| 1 | 0.00 | 17 | 11 | 14.2 | 3.02 | 116 | 14.88 | 4492 | 6529 |
| 2 | 0.00 | 11 | 1 | 7.8 | 3.44 | 116 | 7.01 | 12317 | 15553 |
| 3 | 0.00 | 13 | -0 | 6.7 | 1.45 | 117 | 8.54 | 12361 | 15276 |
| 4 | 0.00 | 18 | 9 | 12.5 | 1.96 | 116 | 12.35 | 8972 | 11943 |
| 5 | 0.00 | 15 | 11 | 13.6 | 1.61 | 117 | 14.84 | 3399 | 5036 |
| 6 | 0.00 | 21 | 13 | 16.1 | 2.38 | 117 | 15.61 | 11083 | 14774 |
| 7 | 0.00 | 15 | 9 | 12.0 | 2.03 | 116 | 11.67 | 5986 | 8064 |
| 8 | 0.00 | 17 | 7 | 13.0 | 2.53 | 118 | 13.20 | 2977 | 4486 |
| 9 | 0.00 | 11 | 2 | 6.6 | 2.81 | 117 | 5.49 | 10297 | 12845 |
| 10 | 0.00 | 5 | 1 | 3.4 | 3.92 | 117 | 4.01 | 10230 | 12857 |
| 11 | 0.00 | 7 | -0 | 3.7 | 1.93 | 117 | 4.46 | 12370 | 15007 |
| 12 | 0.00 | 14 | 6 | 10.1 | 2.48 | 117 | 9.81 | 8446 | 11050 |
| 13 | 0.00 | 18 | 10 | 14.1 | 3.15 | 116 | 12.62 | 9092 | 12033 |
| 14 | 0.00 | 20 | 11 | 14.7 | 2.54 | 116 | 13.24 | 10942 | 14405 |
| 15 | 0.00 | 21 | 12 | 15.6 | 3.71 | 113 | 14.38 | 7913 | 10501 |
| 16 | 0.00 | 16 | 5 | 12.1 | 3.91 | 110 | 10.82 | 2762 | 4319 |
| 17 | 0.00 | 5 | -2 | 0.2 | 3.98 | 110 | 3.13 | 13770 | 16306 |
| 18 | 0.00 | 9 | -1 | 3.9 | 1.75 | 110 | 6.94 | 2606 | 3994 |
| 19 | 0.00 | 10 | 3 | 5.6 | 2.37 | 110 | 7.27 | 10114 | 12821 |
| 20 | 0.00 | 4 | 1 | 2.7 | 3.80 | 110 | 3.57 | 12706 | 15569 |
| 21 | 0.00 | 2 | -2 | -0.5 | 2.04 | 110 | 4.02 | 5206 | 6868 |
| 22 | 0.00 | 5 | 2 | 4.0 | 2.17 | 110 | 7.52 | 3636 | 5176 |
| 23 | 0.00 | 6 | -2 | 3.2 | 1.93 | 110 | 5.97 | 9156 | 11982 |
| 24 | 0.00 | 7 | -2 | 1.8 | 1.93 | 110 | 5.24 | 8813 | 10661 |
| Mon. Tot. Precip. 0.0 mm | Mean wind vel. 2.618 m/s |
| Mon. Mean Temp. 8.2 deg. C | Wind dir 114 deg |
| Mean Max. Temp. 12.0 deg. C | Mean Min. Temp. 4.4 deg. C |
| Extreme Max. Temp 20.9 deg. C | Mean vapor press 9.02 mb |
| Extreme Min. Temp -2.4 deg. C | Total Solar Rad 199645 KJ/sq. m |
| Total photosyn. 258052 mMoles/sq.m |
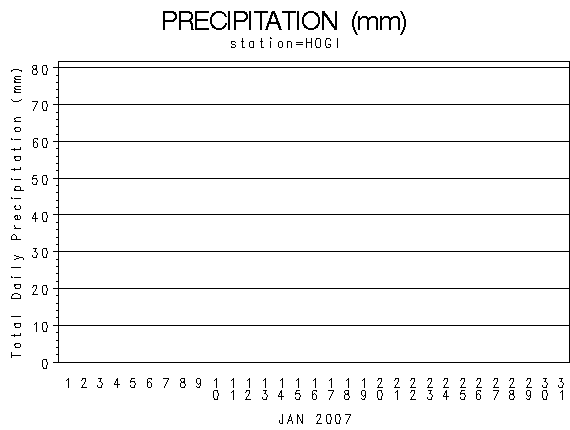 |
| Daily Total Precipitation (mm) |

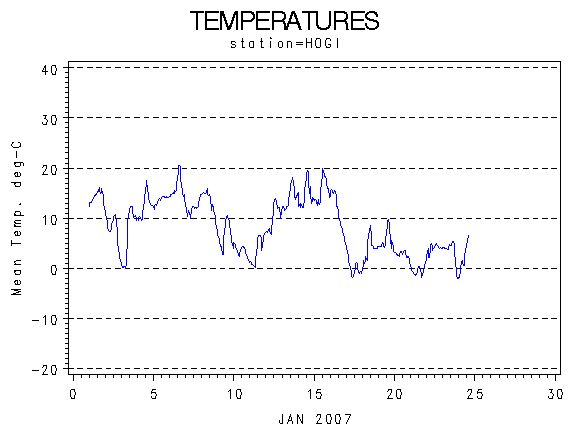 |
| Hourly Mean Temperatures (deg. C) |

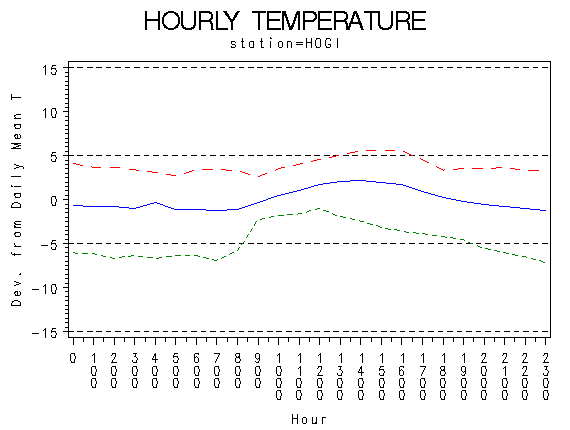 |
| Hourly Max Min and Mean Temperatures (deg. C) |

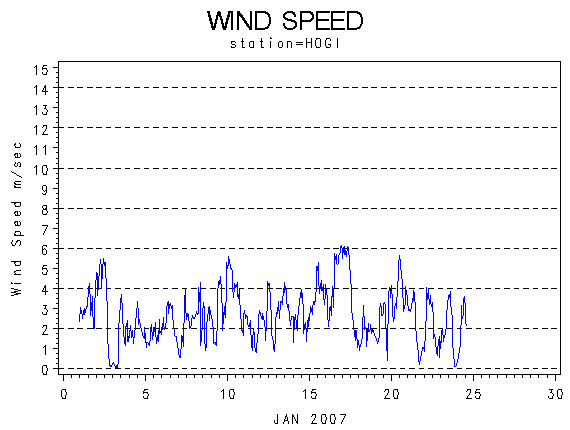 |
| Wind Speed (m/s) |

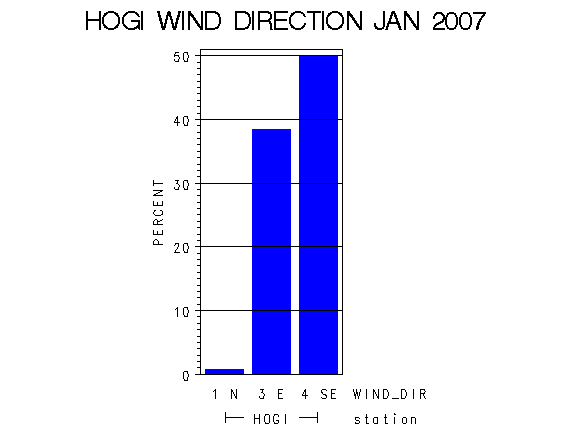 |
| Frequency of Wind Direction |

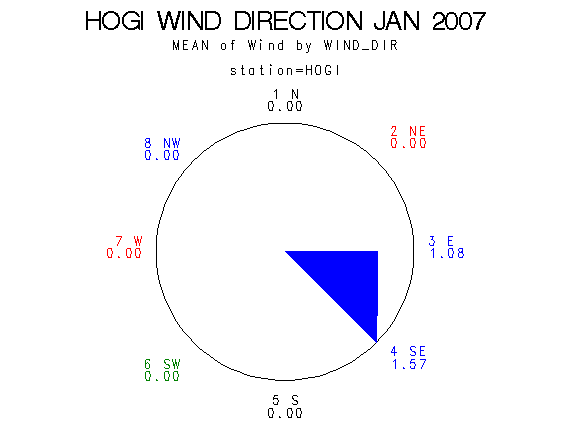 |
| Wind Vectors (circle=1.5 m/s) |

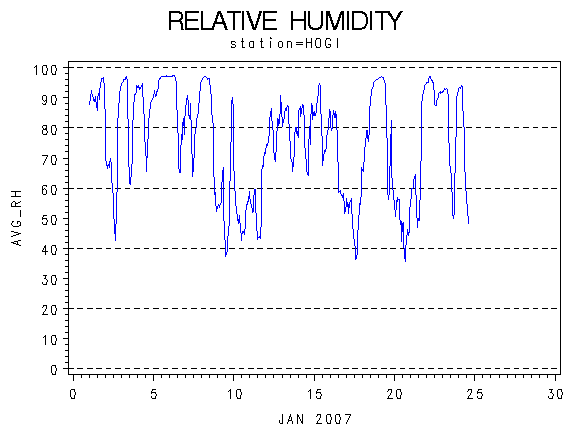 |
| Relative Humidity (percent) |

 |
| Photosynthetically Active Radiation (milli-moles per m squared) |

 |
| Hourly Photosynthetically Active Radiation (milliMoles per m squared) |

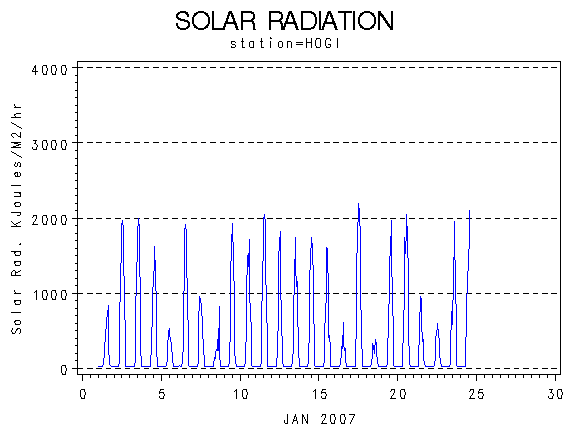 |
| Solar Radiation (KiloJoules per Meter Squared) |

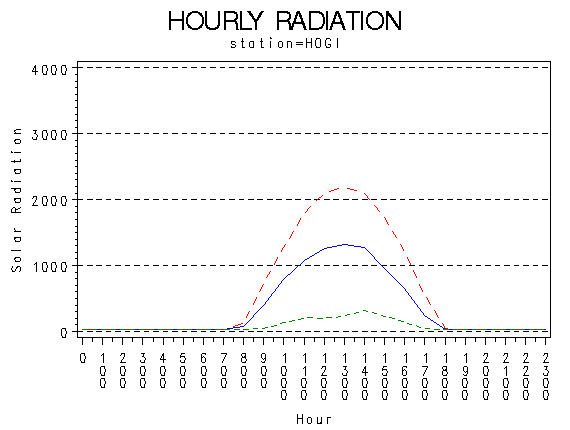 |
| Hourly Solar Radiation (KiloJoules per Meter Squared) |

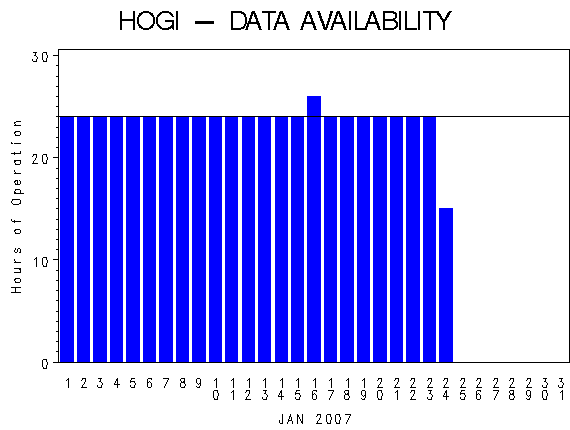 |
| Hours of Station Operation |

 |
| Data Logger Battery Voltage and Internal Logger Temperature |
