

| VIRGINIA COAST RESERVE LONG-TERM ECOLOGICAL RESEARCH |
Site HOGI, Month DEC, Year 2006 |

| 
|
| Day of Month | Precip (mm) | Max Temp. oC | Min Temp. oC | Mean Temp. oC | Wind Speed (m/s) | Wind Dir (deg.) | Vapor Press. (mb) | Solar Rad. KJ/m2 | PAR mMoles/m2 |
|---|---|---|---|---|---|---|---|---|---|
| 1 | 0.00 | 19 | 15 | 16.9 | 3.11 | 115 | 17.83 | 6831 | 8844 |
| 2 | 0.00 | 19 | 7 | 10.4 | 3.38 | 116 | 7.78 | 11520 | 13369 |
| 3 | 0.00 | 12 | 5 | 8.4 | 2.69 | 117 | 7.64 | 7557 | 9074 |
| 4 | 0.00 | 10 | -1 | 4.7 | 4.23 | 117 | 5.78 | 12140 | 14275 |
| 5 | 0.00 | 8 | -3 | 2.9 | 1.99 | 117 | 4.37 | 12476 | 14032 |
| 6 | 0.00 | 12 | -2 | 7.3 | 1.92 | 116 | 7.54 | 12163 | 14036 |
| 7 | 0.00 | 16 | 2 | 10.7 | 3.14 | 116 | 8.84 | 9940 | 11532 |
| 8 | 0.00 | 2 | -2 | -0.3 | 4.35 | 117 | 3.02 | 11762 | 13880 |
| 9 | 0.00 | 6 | -5 | 0.9 | 1.43 | 117 | 4.11 | 8894 | 10547 |
| 10 | 0.00 | 12 | 0 | 5.4 | 1.65 | 116 | 5.67 | 12102 | 14249 |
| 11 | 0.00 | 16 | 1 | 6.9 | 0.92 | 116 | 6.86 | 12298 | 14311 |
| 12 | 0.00 | 15 | 1 | 7.8 | 1.05 | 116 | 9.91 | 11669 | 14557 |
| 13 | 0.00 | 16 | 8 | 11.4 | 1.16 | 116 | 12.93 | 3982 | 5168 |
| 14 | 0.00 | 15 | 7 | 10.1 | 1.00 | 116 | 11.70 | 11422 | 13951 |
| 15 | 0.00 | 16 | 7 | 11.2 | 2.04 | 116 | 11.59 | 11492 | 14292 |
| 16 | 0.00 | 13 | 2 | 8.2 | 1.42 | 116 | 7.47 | 12114 | 15221 |
| 17 | 0.00 | 15 | 2 | 9.4 | 2.04 | 116 | 9.52 | 10489 | 13157 |
| 18 | 0.00 | 13 | 10 | 11.3 | 2.13 | 116 | 10.76 | 921 | 1257 |
| Mon. Tot. Precip. 0.0 mm | Mean wind vel. 2.203 m/s |
| Mon. Mean Temp. 8.0 deg. C | Wind dir 116 deg |
| Mean Max. Temp. 13.0 deg. C | Mean Min. Temp. 3.0 deg. C |
| Extreme Max. Temp 19.1 deg. C | Mean vapor press 8.52 mb |
| Extreme Min. Temp -4.6 deg. C | Total Solar Rad 179772 KJ/sq. m |
| Total photosyn. 215751 mMoles/sq.m |
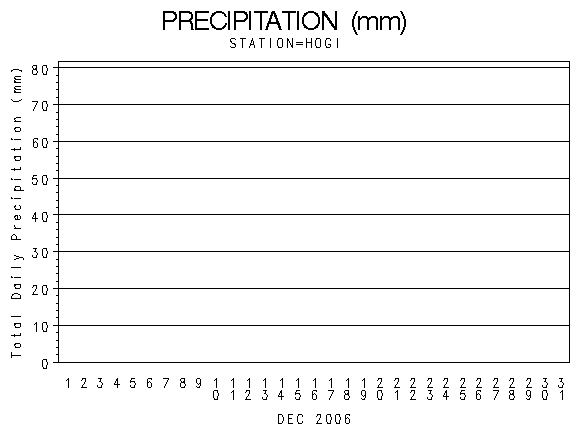 |
| Daily Total Precipitation (mm) |

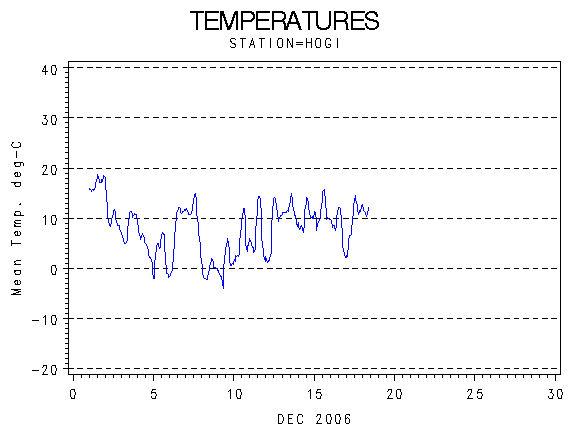 |
| Hourly Mean Temperatures (deg. C) |

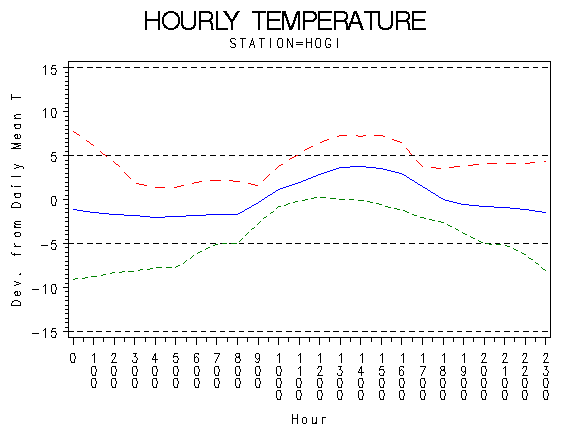 |
| Hourly Max Min and Mean Temperatures (deg. C) |

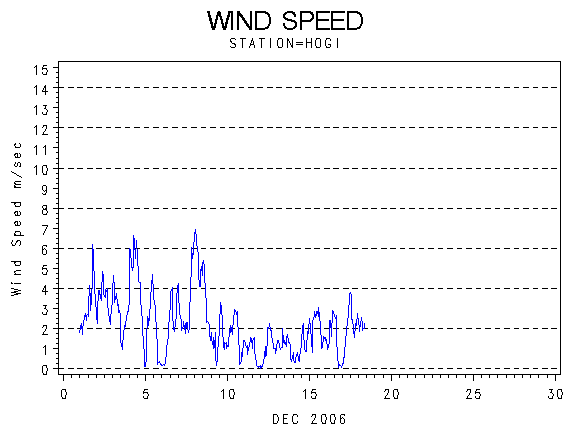 |
| Wind Speed (m/s) |

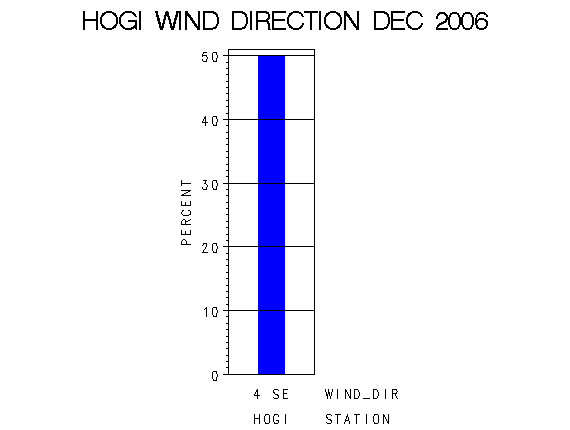 |
| Frequency of Wind Direction |

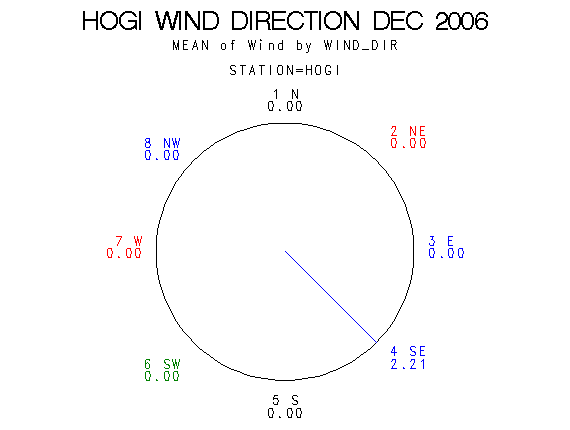 |
| Wind Vectors (circle=1.5 m/s) |

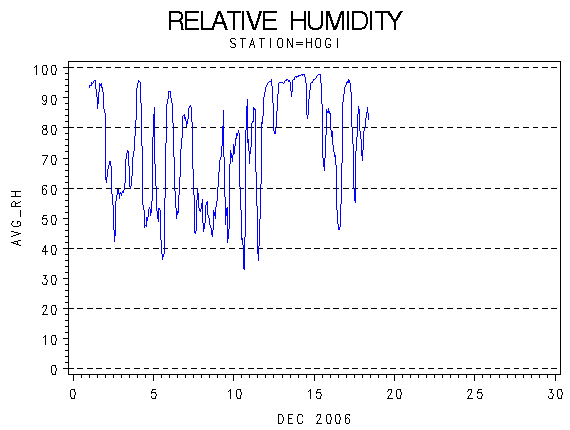 |
| Relative Humidity (percent) |

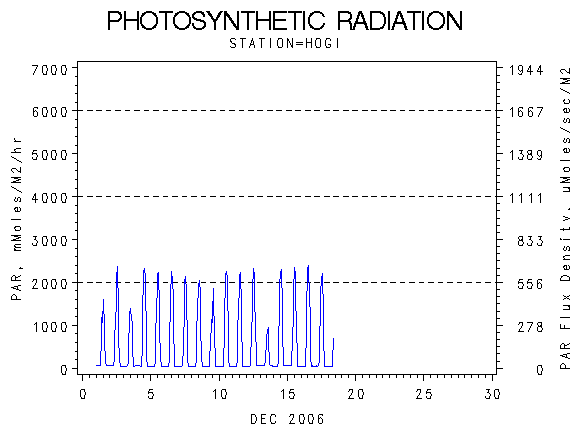 |
| Photosynthetically Active Radiation (milli-moles per m squared) |

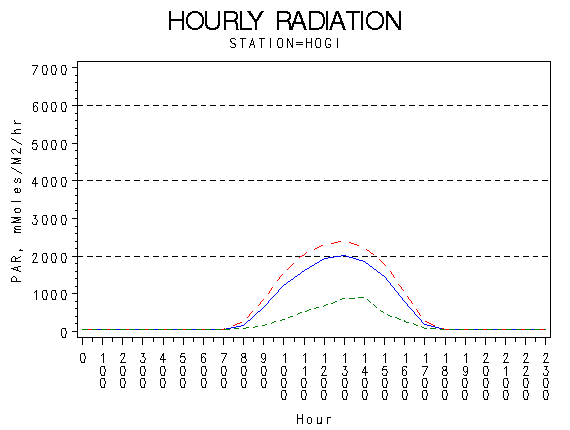 |
| Hourly Photosynthetically Active Radiation (milliMoles per m squared) |

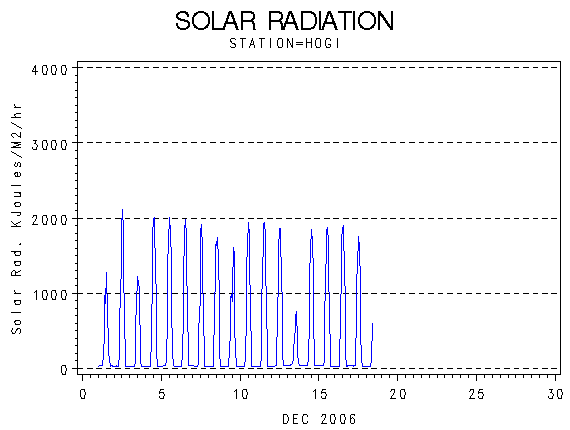 |
| Solar Radiation (KiloJoules per Meter Squared) |

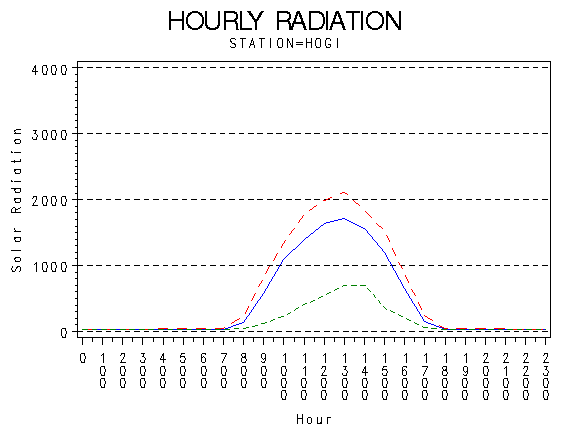 |
| Hourly Solar Radiation (KiloJoules per Meter Squared) |

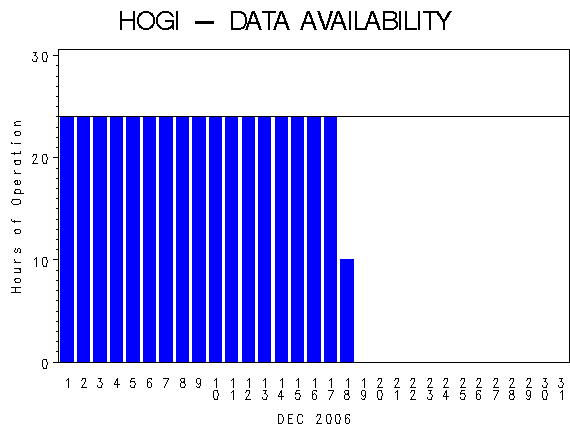 |
| Hours of Station Operation |

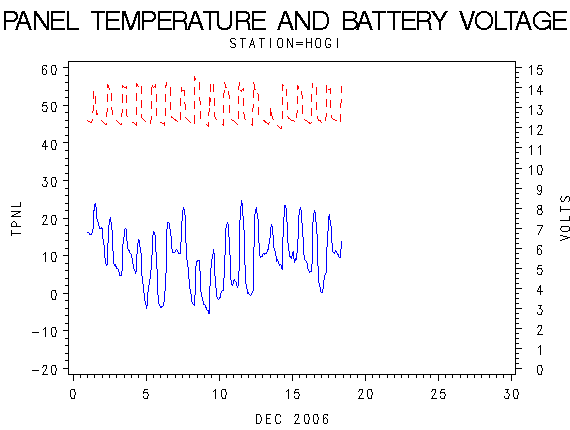 |
| Data Logger Battery Voltage and Internal Logger Temperature |
