
|
| VIRGINIA COAST RESERVE LONG-TERM ECOLOGICAL RESEARCH |
Site HOGI, Month DEC, Year 2005 |

| 
|
| Day of Month | Precip (mm) | Max Temp. oC | Min Temp. oC | Mean Temp. oC | Wind Speed (m/s) | Wind Dir (deg.) | Vapor Press. (mb) | Solar Rad. KJ/m2 | PAR mMoles/m2 |
|---|---|---|---|---|---|---|---|---|---|
| 1 | 0.25 | . | . | . | 3.10 | 305 | . | 9598 | 12625 |
| 2 | 0.00 | . | . | . | 3.82 | 279 | . | 9774 | 12372 |
| 3 | 0.00 | . | . | . | 2.46 | 276 | . | 11312 | 14552 |
| 4 | 5.84 | . | . | . | 3.40 | 284 | . | 4744 | 6733 |
| 5 | 27.69 | . | . | . | 4.57 | 93 | . | 941 | 1573 |
| 6 | 5.33 | . | . | . | 3.89 | 317 | . | 5938 | 7894 |
| 7 | 0.00 | . | . | . | 1.87 | 310 | . | 11458 | 14387 |
| 8 | 0.00 | . | . | . | 2.68 | 357 | . | 8295 | 10506 |
| 9 | 12.45 | . | . | . | 4.12 | 263 | . | 8159 | 10787 |
| 10 | 0.00 | . | . | . | 2.01 | 270 | . | 10412 | 13143 |
| 11 | 0.00 | . | . | . | 2.60 | 279 | . | 11415 | 14903 |
| 12 | 0.00 | . | . | . | 2.37 | 298 | . | 8484 | 11185 |
| 13 | 0.00 | . | . | . | 4.33 | 299 | . | 12009 | 14554 |
| 14 | 0.00 | . | . | . | 3.48 | 352 | . | 5122 | 6737 |
| 15 | 17.53 | . | . | . | 2.76 | 208 | . | 1523 | 2288 |
| 16 | 5.33 | . | . | . | 2.63 | 279 | . | 10904 | 14317 |
| 17 | 0.00 | . | . | . | 1.64 | 98 | . | 3835 | 5533 |
| 18 | 0.00 | . | . | . | 2.12 | 65 | . | 2928 | 4363 |
| 19 | 0.00 | . | . | . | 1.74 | 299 | . | 8733 | 11536 |
| 20 | 0.00 | . | . | . | 1.52 | 289 | . | 11902 | 14396 |
| 21 | 0.00 | . | . | . | 2.72 | 317 | . | 10401 | 12549 |
| Mon. Tot. Precip. 74.4 mm | Mean wind vel. 2.849 m/s |
| Mon. Mean Temp. . deg. C | Wind dir 294 deg |
| Mean Max. Temp. . deg. C | Mean Min. Temp. . deg. C |
| Extreme Max. Temp . deg. C | Mean vapor press . mb |
| Extreme Min. Temp . deg. C | Total Solar Rad 167887 KJ/sq. m |
| Total photosyn. 216935 mMoles/sq.m |
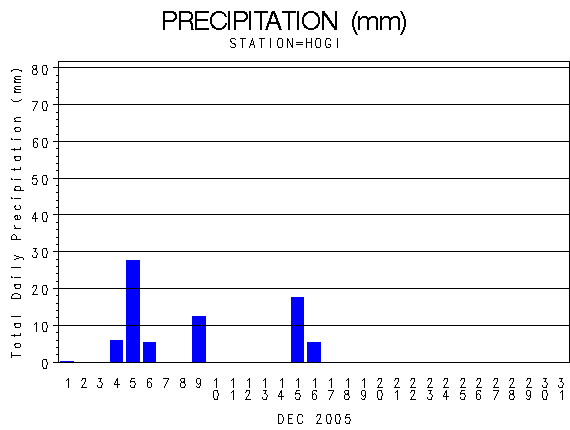 |
| Daily Total Precipitation (mm) |

 |
| Hourly Mean Temperatures (deg. C) |
 |
| Hourly Max Min and Mean Temperatures (deg. C) |
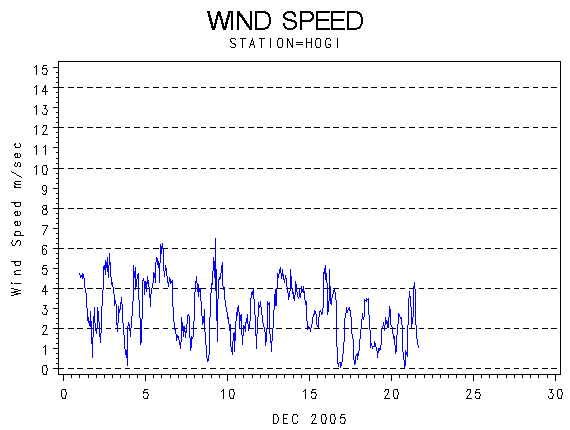 |
| Wind Speed (m/s) |
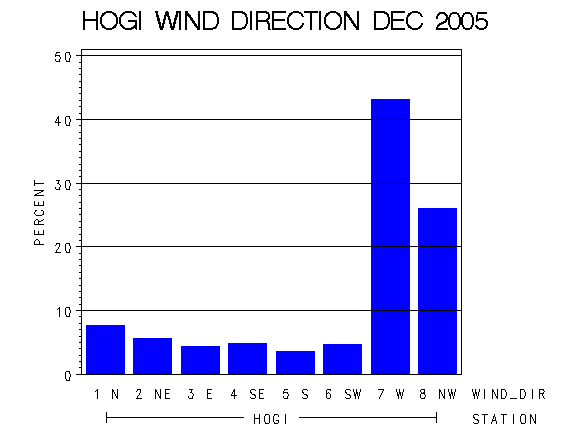 |
| Frequency of Wind Direction |
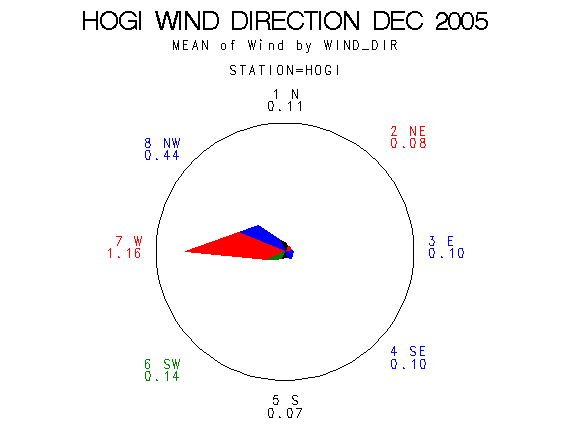 |
| Wind Vectors (circle=1.5 m/s) |
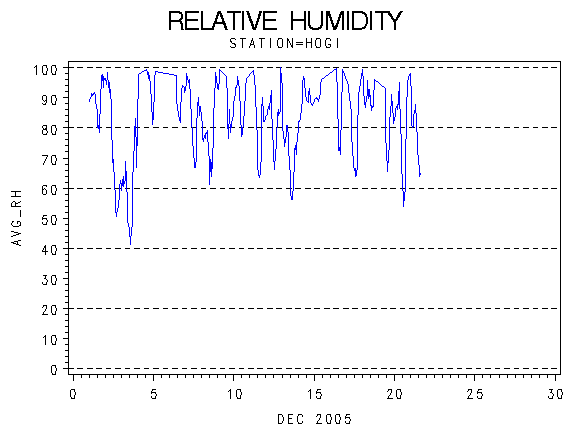 |
| Relative Humidity (percent) |
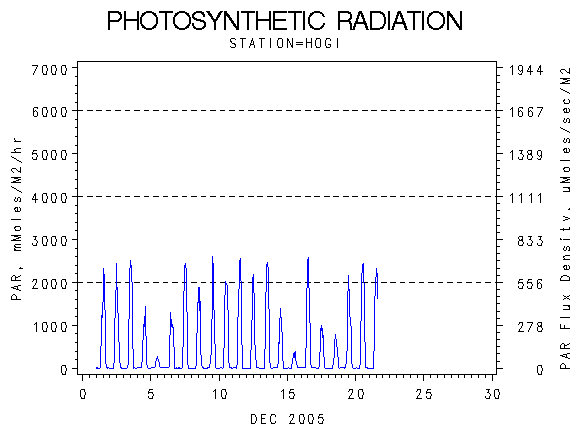 |
| Photosynthetically Active Radiation (milli-moles per m squared) |
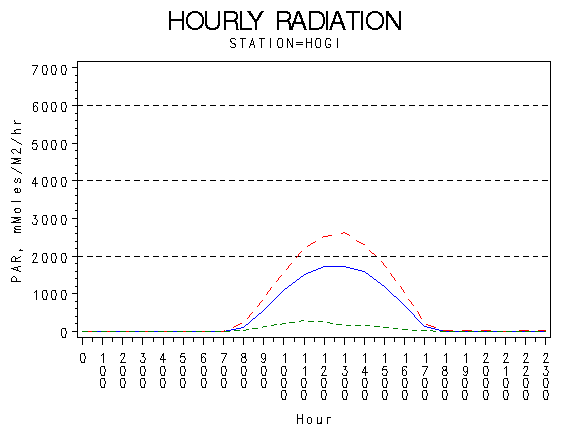 |
| Hourly Photosynthetically Active Radiation (milliMoles per m squared) |
 |
| Solar Radiation (KiloJoules per Meter Squared) |
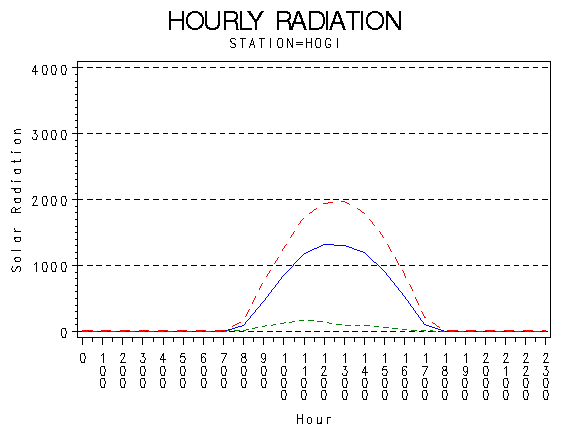 |
| Hourly Solar Radiation (KiloJoules per Meter Squared) |
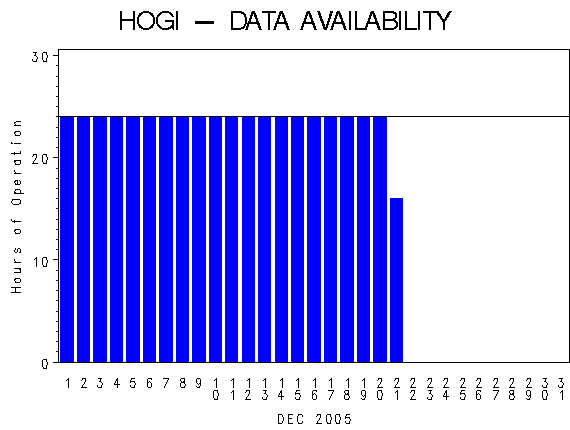 |
| Hours of Station Operation |
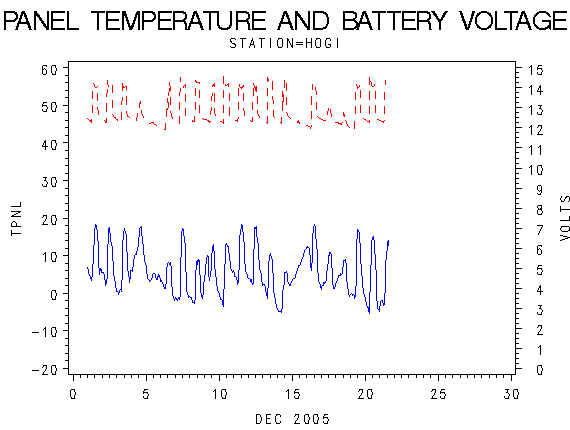 |
| Data Logger Battery Voltage and Internal Logger Temperature |