
|
| VIRGINIA COAST RESERVE LONG-TERM ECOLOGICAL RESEARCH |
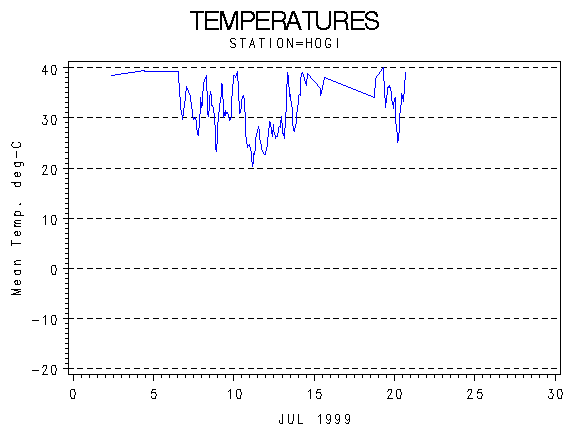
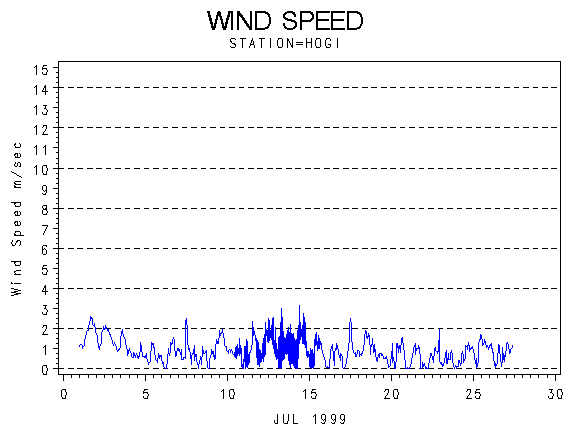
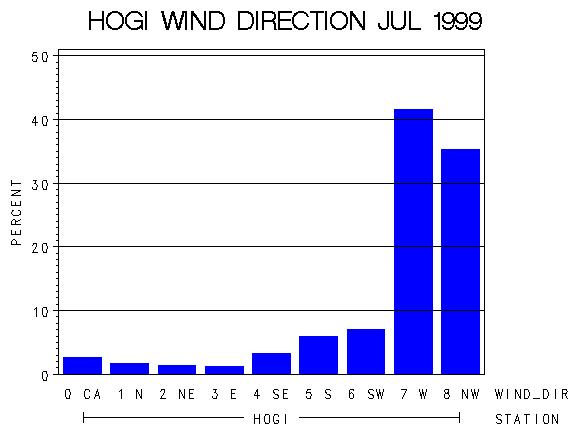
Site HOGI, Month JUL, Year 1999 |

| 
|
| Day of Month | Precip (mm) | Max Temp. oC | Min Temp. oC | Mean Temp. oC | Wind Speed (m/s) | Wind Dir (deg.) | Vapor Press. (mb) | Solar Rad. KJ/m2 | PAR uE/m2 |
|---|---|---|---|---|---|---|---|---|---|
| 1 | 0.00 | . | 41 | 45.6 | 1.79 | 278 | 86.36 | 26446 | 43357 |
| 2 | 0.00 | 44 | 36 | 39.5 | 1.64 | 282 | 63.65 | 27224 | 44452 |
| 3 | 0.00 | 45 | 39 | 42.3 | 1.20 | 287 | 68.76 | 24204 | 39788 |
| 4 | 0.00 | 44 | 38 | 42.0 | 0.69 | 293 | 63.26 | 26424 | 42393 |
| 5 | 0.00 | 48 | 42 | 45.4 | 0.59 | 303 | 66.66 | 27400 | 42976 |
| 6 | 0.00 | 47 | 30 | 34.9 | 0.70 | 283 | 45.15 | 26791 | 42278 |
| 7 | 1.02 | 43 | 26 | 33.2 | 0.93 | 258 | 46.49 | 20845 | 33975 |
| 8 | 0.00 | 42 | 22 | 32.4 | 0.48 | 301 | 39.20 | 26721 | 41051 |
| 9 | 0.00 | 39 | 27 | 31.9 | 1.21 | 285 | 42.87 | 26783 | 42281 |
| 10 | 2.54 | 40 | 24 | 32.5 | 0.75 | 289 | 40.22 | 45584 | 70598 |
| 11 | 8.64 | 29 | 20 | 24.2 | 0.93 | 256 | 25.32 | 44229 | 68233 |
| 12 | 0.76 | 31 | 22 | 27.1 | 1.35 | 218 | 31.39 | 30572 | 48201 |
| 13 | 3.81 | 43 | 26 | 31.1 | 1.06 | 139 | 44.17 | 37117 | 57647 |
| 14 | 19.56 | 46 | 32 | 39.6 | 1.28 | 184 | 69.91 | 31606 | 50855 |
| 15 | 0.00 | 39 | 33 | 37.7 | 0.86 | 237 | 50.96 | 41201 | 64278 |
| 16 | 22.36 | . | . | . | 0.59 | 287 | . | 13346 | 20671 |
| 17 | 0.00 | . | . | . | 0.82 | 227 | . | 25391 | 37101 |
| 18 | 8.64 | 43 | 33 | 39.2 | 1.17 | 286 | 65.85 | 21153 | 30620 |
| 19 | 0.00 | 45 | 31 | 36.9 | 0.51 | 306 | 54.12 | 25052 | 35704 |
| 20 | 0.00 | 44 | 24 | 30.9 | 0.69 | 315 | 36.35 | 24695 | 35752 |
| 21 | 0.00 | . | . | . | 0.51 | 312 | . | 23500 | 34524 |
| 22 | 0.76 | . | . | . | 0.53 | 297 | . | 23730 | 34200 |
| 23 | 0.00 | . | . | . | 0.35 | 305 | . | 24659 | 34824 |
| 24 | 0.00 | . | . | . | 0.67 | 287 | . | 26193 | 37454 |
| 25 | 0.00 | . | . | . | 0.98 | 277 | . | 24278 | 33022 |
| 26 | 3.05 | . | . | . | 0.63 | 298 | . | 21928 | 30021 |
| 27 | 0.25 | . | . | . | 1.04 | 324 | . | 5432 | 7670 |
| Mon. Tot. Precip. 71.4 mm | Mean wind vel. 0.886 m/s |
| Mon. Mean Temp. 35.9 deg. C | Wind dir 280 deg |
| Mean Max. Temp. 41.9 deg. C | Mean Min. Temp. 30.4 deg. C |
| Extreme Max. Temp 48.0 deg. C | Mean vapor press 52.26 mb |
| Extreme Min. Temp 20.0 deg. C | Total Solar Rad 722505 KJ/sq. m |
| Total photosyn. 1103928 uEin/sq.m |
 |
| Daily Total Precipitation (mm) |

 |
| Hourly Mean Temperatures (deg. C) |
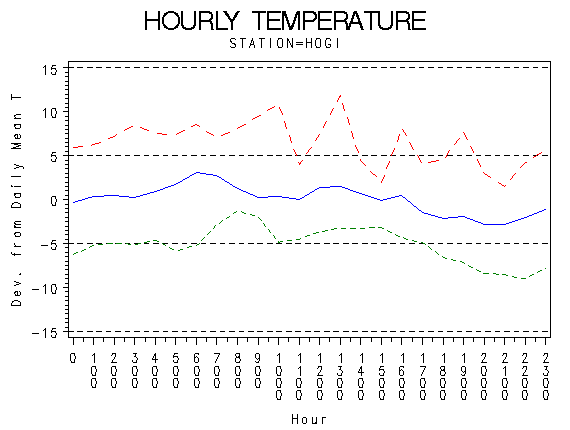 |
| Hourly Max Min and Mean Temperatures (deg. C) |
 |
| Wind Speed (m/s) |
 |
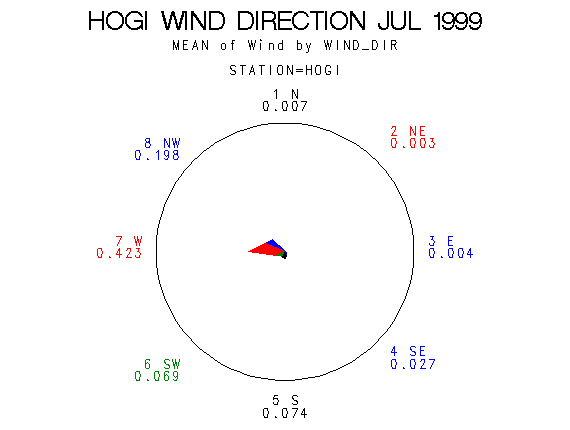
| Frequency of Wind Direction |
 |
| Wind Vectors (circle=1.5 m/s) |
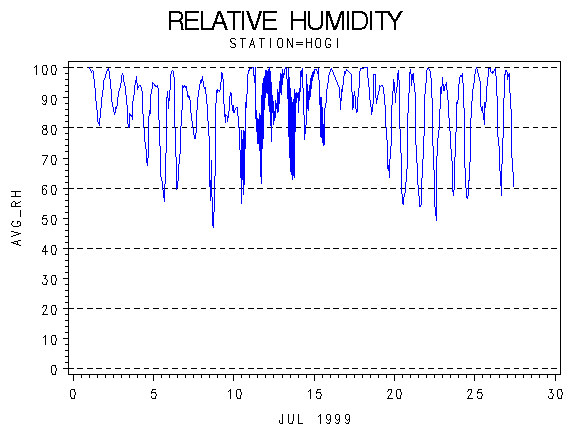 |
| Relative Humidity (percent) |
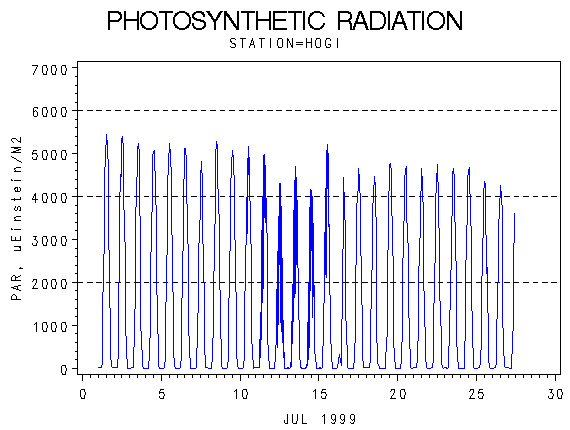 |
| Photosynthetically Active Radiation (micro-einsteins per m squared) |
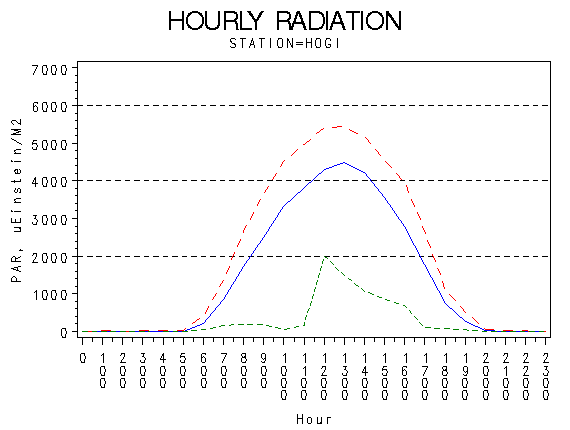 |
| Hourly Photosynthetically Active Radiation (micro-einsteins per m squared) |
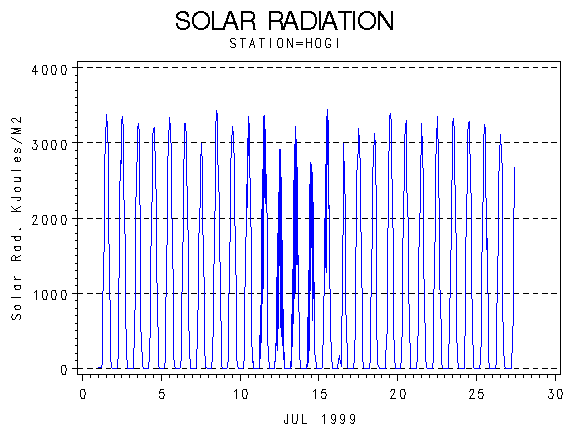 |
| Solar Radiation (KiloJoules per Meter Squared) |
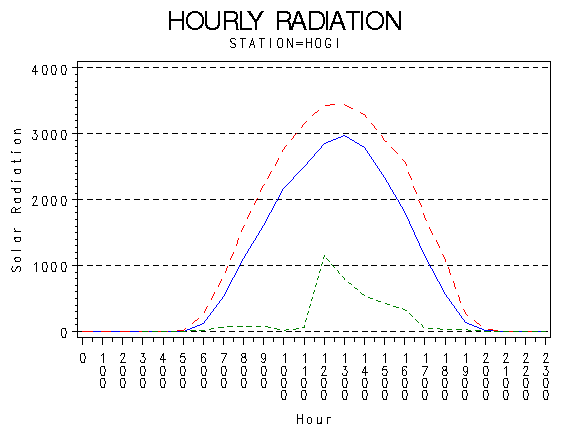 |
| Hourly Solar Radiation (KiloJoules per Meter Squared) |
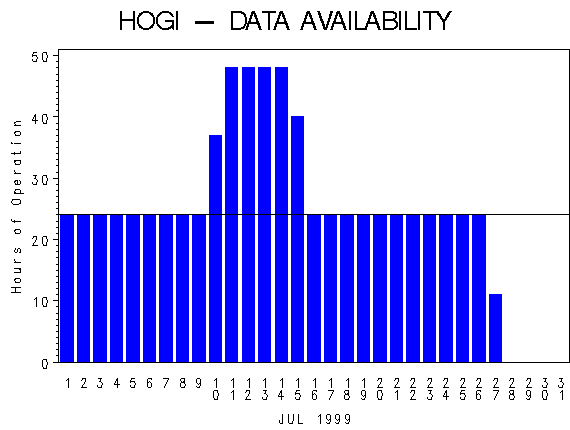 |
| Hours of Station Operation |
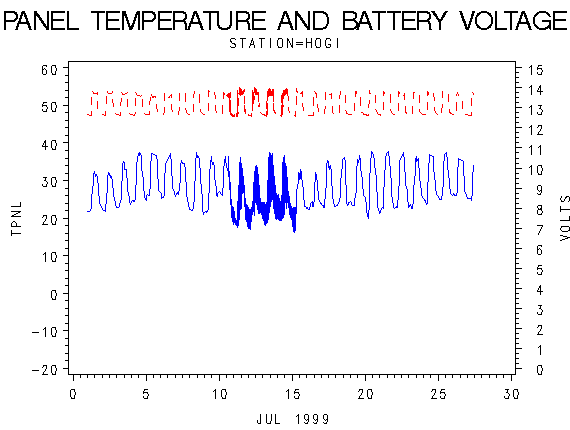 |
| Data Logger Battery Voltage and Internal Logger Temperature |