

| VIRGINIA COAST RESERVE LONG-TERM ECOLOGICAL RESEARCH |
Site HOGI, Month JUN, Year 1998 |

| 
|
| Day of Month | Precip (mm) | Max Temp. oC | Min Temp. oC | Mean Temp. oC | Wind Speed (m/s) | Wind Dir (deg.) | Vapor Press. (mb) | Solar Rad. KJ/m2 | PAR uE/m2 |
|---|---|---|---|---|---|---|---|---|---|
| 1 | 0.00 | 27 | 17 | 22.8 | 0.88 | 302 | 22.20 | 24128 | 39369 |
| 2 | 0.00 | 25 | 14 | 20.5 | 1.09 | 275 | 20.71 | 28513 | 45762 |
| 3 | 1.02 | 29 | 18 | 23.5 | 0.83 | 260 | 22.24 | 28801 | 45819 |
| 4 | 0.00 | 23 | 15 | 19.1 | 0.84 | 244 | 16.22 | 25413 | 42281 |
| 5 | 1.78 | 22 | 16 | 18.6 | 0.77 | 199 | 16.31 | 15275 | 27030 |
| 6 | 0.00 | 22 | 16 | 19.2 | 0.51 | 318 | 14.87 | 25220 | 41578 |
| 7 | 0.00 | 22 | 16 | 18.6 | 1.09 | 313 | 11.76 | 23921 | 38781 |
| 8 | 0.00 | 24 | 13 | 18.5 | 0.81 | 309 | 12.26 | 29421 | 46815 |
| 9 | 9.65 | 25 | 12 | 17.4 | 0.19 | 224 | 14.60 | 18664 | 30533 |
| 10 | 5.33 | 19 | 14 | 16.7 | 1.21 | 242 | 18.53 | 6072 | 11701 |
| 11 | 3.05 | 20 | 17 | 18.5 | 0.89 | 194 | 20.66 | 11198 | 20590 |
| 12 | 24.64 | 24 | 19 | 21.0 | 1.27 | 272 | 24.26 | 11713 | 20741 |
| 13 | 9.65 | 37 | 18 | 23.4 | 0.69 | 293 | 26.15 | 18523 | 31213 |
| 14 | 0.00 | 28 | 18 | 22.4 | 0.55 | 295 | 22.08 | 27801 | 44489 |
| 15 | 8.38 | 27 | 20 | 23.1 | 1.10 | 279 | 26.13 | 22559 | 37425 |
| 16 | 7.11 | 32 | 20 | 24.9 | 0.49 | 285 | 26.41 | 27825 | 44115 |
| 17 | 4.06 | 29 | 19 | 24.3 | 0.08 | 301 | 24.50 | 25886 | 41669 |
| 18 | 0.00 | 31 | 22 | 25.6 | 0.41 | 304 | 25.18 | 27948 | 44492 |
| 19 | 0.00 | 27 | 20 | 23.7 | 0.19 | 304 | 26.03 | 10884 | 18369 |
| 20 | 0.00 | 30 | 22 | 26.1 | 0.31 | 315 | 27.69 | 26868 | 43108 |
| 21 | 0.00 | 33 | 21 | 26.7 | 0.21 | 283 | 28.23 | 27602 | 42732 |
| 22 | 0.00 | 30 | 22 | 25.7 | 0.42 | 229 | 31.04 | 24043 | 39593 |
| 23 | 0.25 | 30 | 24 | 25.9 | 0.45 | 256 | 31.18 | 20529 | 33822 |
| 24 | 0.00 | 28 | 23 | 25.2 | 0.76 | 192 | 30.76 | 17827 | 30160 |
| 25 | 0.00 | 31 | 22 | 26.6 | 0.60 | 283 | 31.52 | 27117 | 42729 |
| 26 | 0.00 | 32 | 23 | 28.2 | 0.97 | 285 | 33.10 | 27261 | 43121 |
| 27 | 1.27 | 34 | 22 | 28.8 | 0.61 | 287 | 30.33 | 23205 | 37891 |
| 28 | 15.74 | 26 | 22 | 23.2 | 1.43 | 219 | 25.45 | 10526 | 19772 |
| 29 | 8.38 | 32 | 22 | 27.2 | 1.20 | 279 | 33.54 | 19939 | 34493 |
| 30 | 0.00 | 45 | 27 | 32.9 | 0.60 | 293 | 39.34 | 25088 | 41890 |
| Mon. Tot. Precip. 100.3 mm | Mean wind vel. 0.715 m/s |
| Mon. Mean Temp. 23.3 deg. C | Wind dir 270 deg |
| Mean Max. Temp. 28.1 deg. C | Mean Min. Temp. 19.2 deg. C |
| Extreme Max. Temp 45.1 deg. C | Mean vapor press 24.44 mb |
| Extreme Min. Temp 12.4 deg. C | Total Solar Rad 659769 KJ/sq. m |
| Total photosyn. 1082081 uEin/sq.m |
 |
| Daily Total Precipitation (mm) |

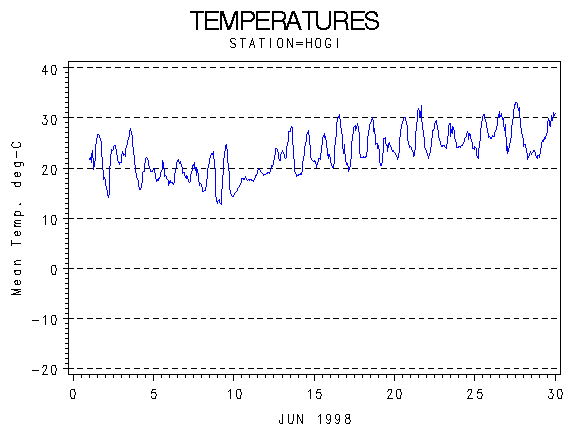 |
| Hourly Mean Temperatures (deg. C) |

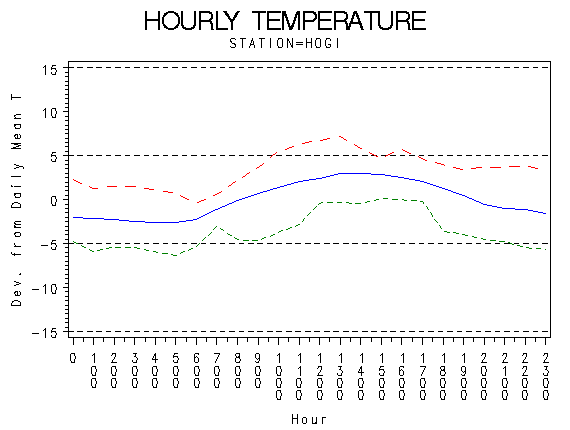 |
| Hourly Max Min and Mean Temperatures (deg. C) |

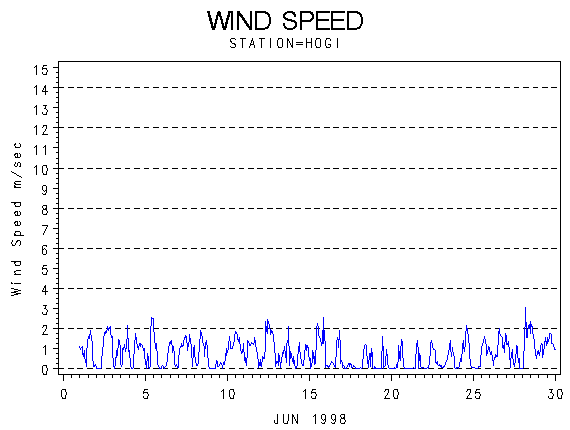 |
| Wind Speed (m/s) |

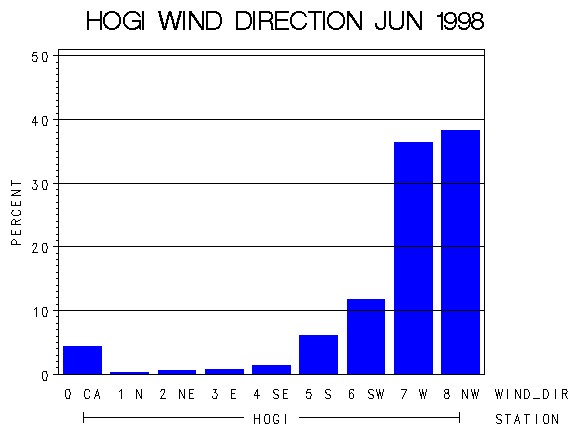 |
| Frequency of Wind Direction |

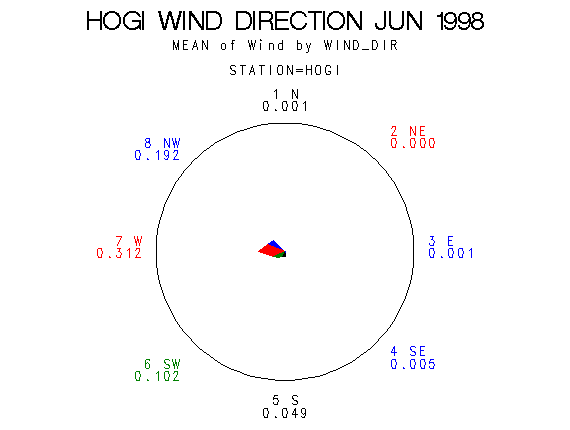 |
| Wind Vectors (circle=1.5 m/s) |

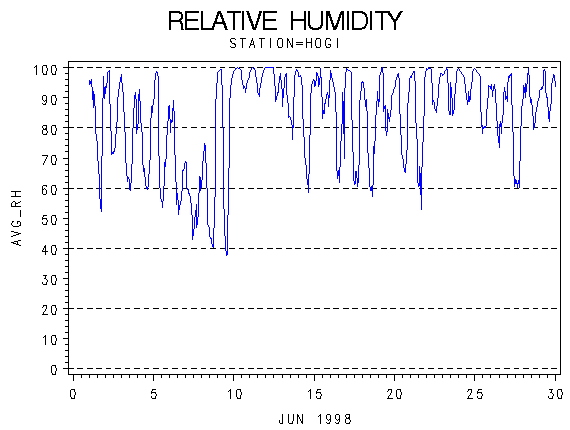 |
| Relative Humidity (percent) |

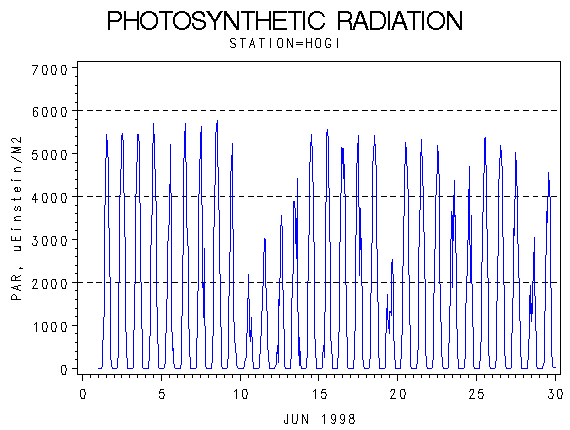 |
| Photosynthetically Active Radiation (micro-einsteins per m squared) |

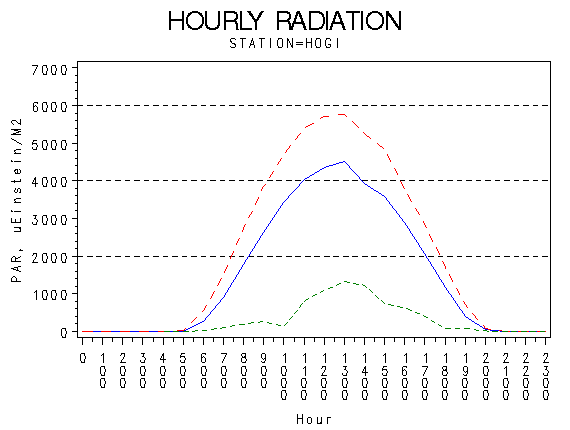 |
| Hourly Photosynthetically Active Radiation (micro-einsteins per m squared) |

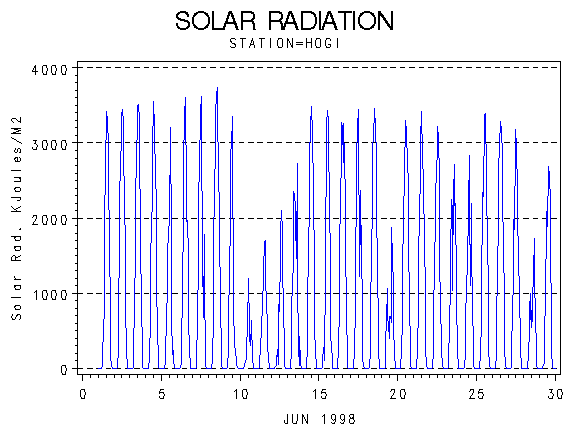 |
| Solar Radiation (KiloJoules per Meter Squared) |

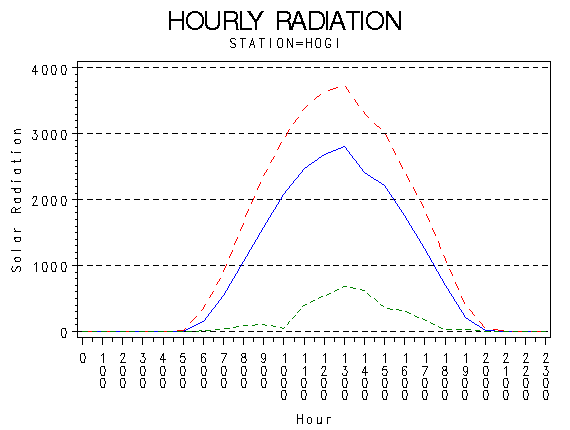 |
| Hourly Solar Radiation (KiloJoules per Meter Squared) |

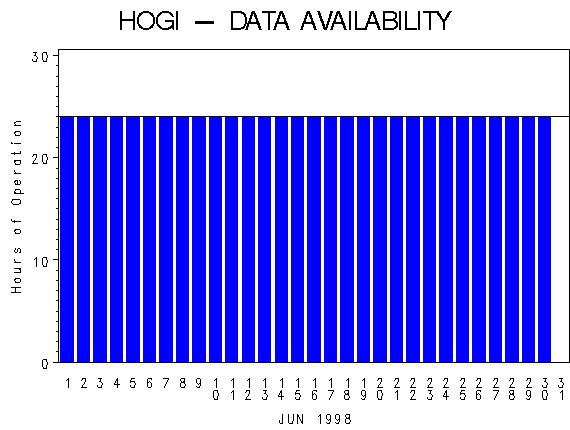 |
| Hours of Station Operation |

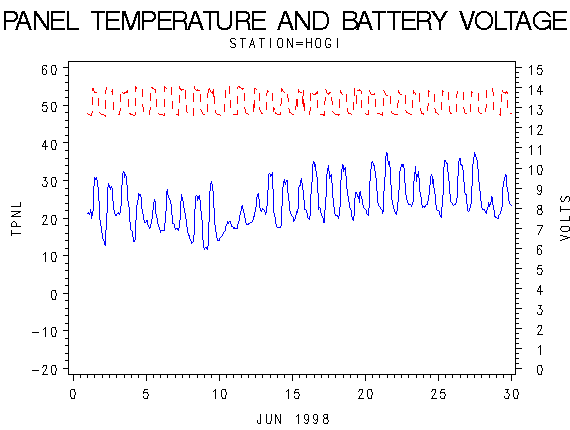 |
| Data Logger Battery Voltage and Internal Logger Temperature |
