

| VIRGINIA COAST RESERVE LONG-TERM ECOLOGICAL RESEARCH |
Site HOGI, Month SEP, Year 1995 |

| 
|
| Day of Month | Precip (mm) | Max Temp. oC | Min Temp. oC | Mean Temp. oC | Wind Speed (m/s) | Wind Dir (deg.) | Vapor Press. (mb) | Solar Rad. KJ/m2 | PAR uE/m2 |
|---|---|---|---|---|---|---|---|---|---|
| 1 | 26.80 | 32 | 21 | 26.0 | 1.41 | 149 | 27.21 | 16999 | 35033 |
| 2 | 2.10 | 27 | 19 | 22.1 | 0.92 | 128 | 21.48 | 14806 | 30109 |
| 3 | 0.00 | 27 | 16 | 22.4 | 1.14 | 158 | 19.54 | 16846 | 33153 |
| 4 | 0.00 | 28 | 14 | 21.3 | 0.75 | 158 | 17.26 | 20754 | 39927 |
| 5 | 0.00 | 28 | 14 | 22.2 | 0.80 | 156 | 17.57 | 18648 | 35756 |
| 6 | 0.00 | 31 | 16 | 22.7 | 0.62 | 163 | 20.04 | 18089 | 34544 |
| 7 | 0.90 | 28 | 18 | 23.5 | 1.04 | 157 | 23.80 | 10085 | 20826 |
| 8 | 0.80 | 27 | 22 | 23.6 | 1.34 | 141 | 25.94 | 11371 | 23817 |
| 9 | 1.10 | 28 | 21 | 23.9 | 1.47 | 158 | 25.84 | 16681 | 33208 |
| 10 | 0.00 | 26 | 19 | 22.2 | 1.00 | 156 | 18.26 | 17183 | 33248 |
| 11 | 0.00 | 25 | 16 | 20.4 | 1.59 | 181 | 15.03 | 20453 | 39167 |
| 12 | 0.00 | 27 | 11 | 20.5 | 0.96 | 185 | 17.18 | 19202 | 37121 |
| 13 | 0.00 | 29 | 21 | 24.5 | 1.36 | 164 | 24.35 | 18409 | 36225 |
| 14 | 0.00 | 30 | 23 | 25.6 | 0.99 | 167 | 27.39 | 14945 | 29909 |
| 15 | 0.00 | 26 | 21 | 23.3 | 2.38 | 194 | 19.56 | 18462 | 35914 |
| 16 | 6.80 | 24 | 20 | 22.2 | 2.67 | 194 | 19.79 | 7435 | 15807 |
| 17 | 25.80 | 23 | 20 | 22.0 | 1.50 | 113 | 24.47 | 3234 | 7659 |
| 18 | 0.00 | 25 | 19 | 21.8 | 1.54 | 152 | 21.30 | 18524 | 36758 |
| 19 | 0.00 | 25 | 19 | 22.0 | 2.34 | 181 | 19.89 | 18194 | 35619 |
| 20 | 0.00 | 25 | 16 | 21.1 | 1.53 | 201 | 17.56 | 17939 | 35364 |
| 21 | 0.00 | 27 | 18 | 22.4 | 1.38 | 173 | 19.63 | 10657 | 22298 |
| 22 | 38.10 | 28 | 16 | 23.6 | 2.37 | 156 | 24.80 | 13632 | 28559 |
| 23 | 3.60 | 17 | 12 | 14.1 | 2.33 | 149 | 12.14 | 4126 | 9374 |
| 24 | 0.30 | 23 | 12 | 17.7 | 2.10 | 164 | 15.08 | 11875 | 24547 |
| 25 | 0.00 | 24 | 18 | 21.2 | 1.72 | 187 | 20.46 | 15189 | 30664 |
| 26 | 0.00 | 21 | 18 | 19.1 | 0.68 | 163 | 19.79 | 5687 | 12149 |
| 27 | 0.00 | 22 | 14 | 17.0 | 0.60 | 153 | 17.27 | 5325 | 10100 |
| Mon. Tot. Precip. 106.3 mm | Mean wind vel. 1.426 m/s |
| Mon. Mean Temp. 21.8 deg. C | Wind dir 166 deg |
| Mean Max. Temp. 26.0 deg. C | Mean Min. Temp. 17.6 deg. C |
| Extreme Max. Temp 31.7 deg. C | Mean vapor press 20.47 mb |
| Extreme Min. Temp 10.8 deg. C | Total Solar Rad 384749 KJ/sq. m |
| Total photosyn. 766854 uEin/sq.m |
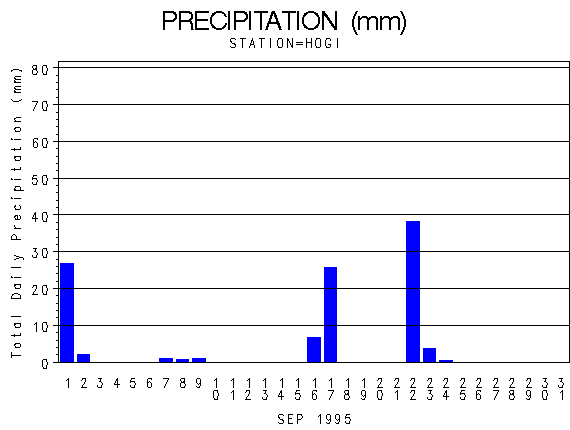 |
| Daily Total Precipitation (mm) |

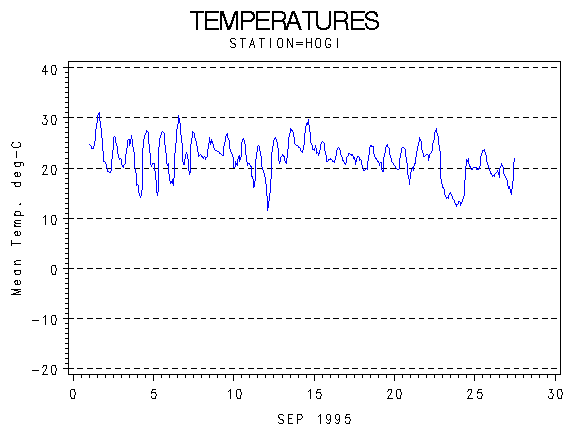 |
| Hourly Mean Temperatures (deg. C) |

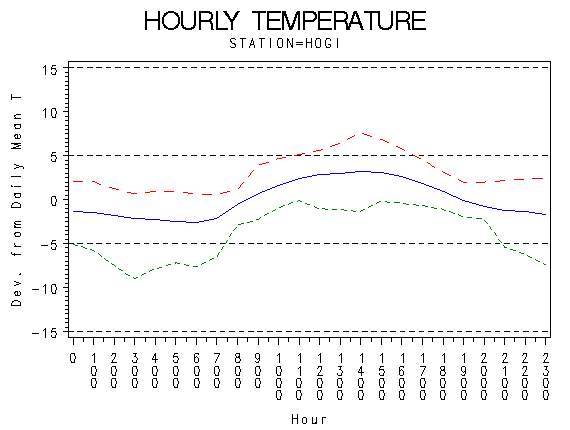 |
| Hourly Max Min and Mean Temperatures (deg. C) |

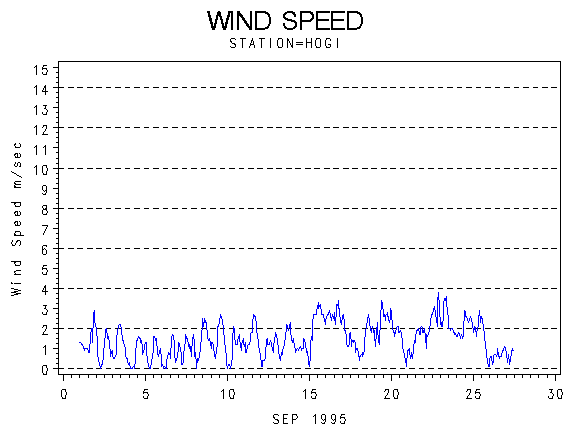 |
| Wind Speed (m/s) |

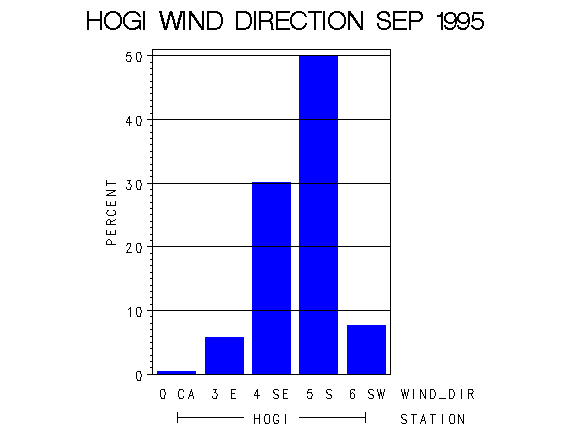 |
| Frequency of Wind Direction |

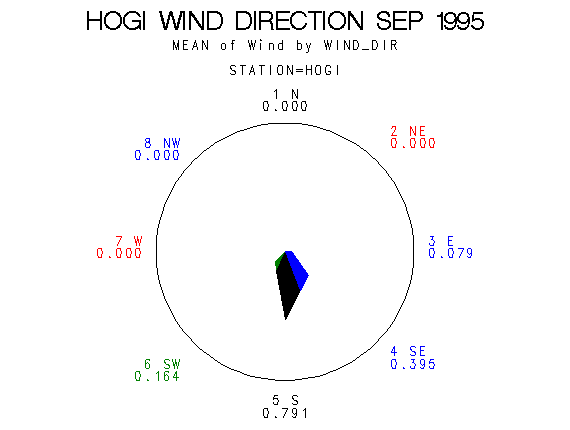 |
| Wind Vectors (circle=1.5 m/s) |

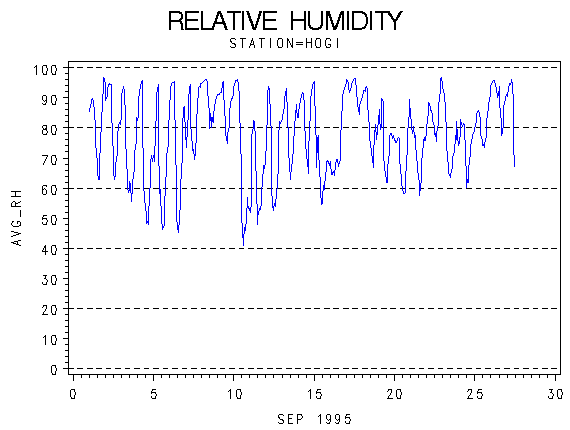 |
| Relative Humidity (percent) |

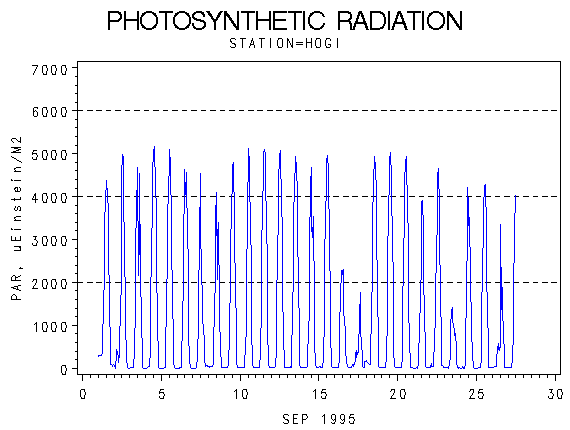 |
| Photosynthetically Active Radiation (micro-einsteins per m squared) |

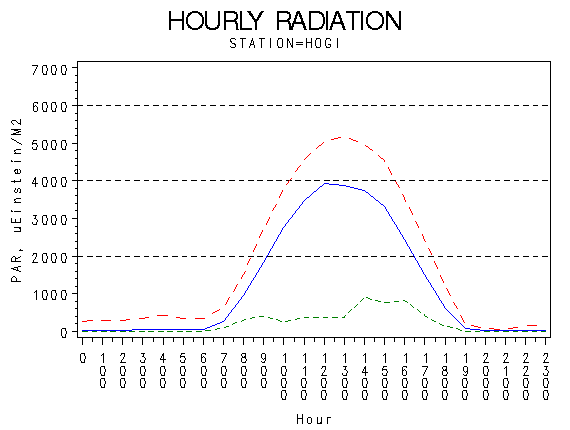 |
| Hourly Photosynthetically Active Radiation (micro-einsteins per m squared) |

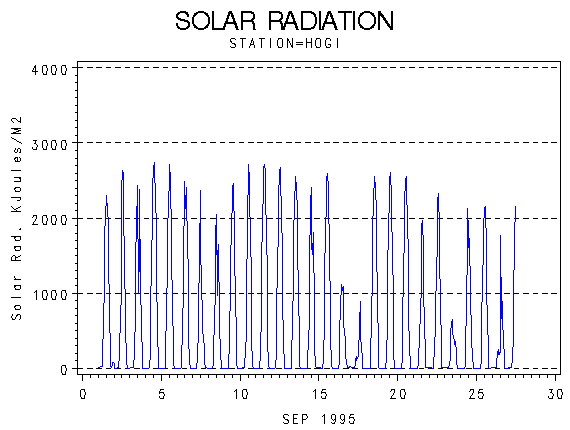 |
| Solar Radiation (KiloJoules per Meter Squared) |

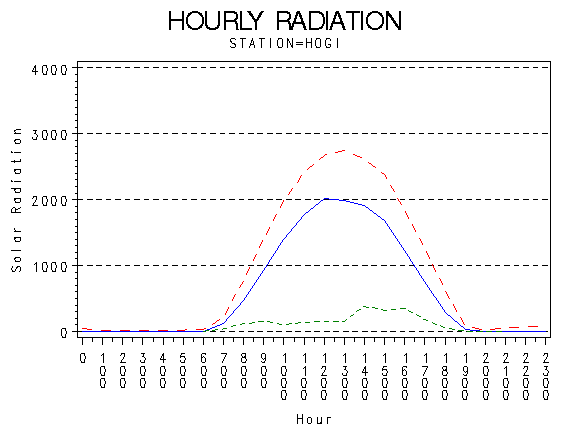 |
| Hourly Solar Radiation (KiloJoules per Meter Squared) |

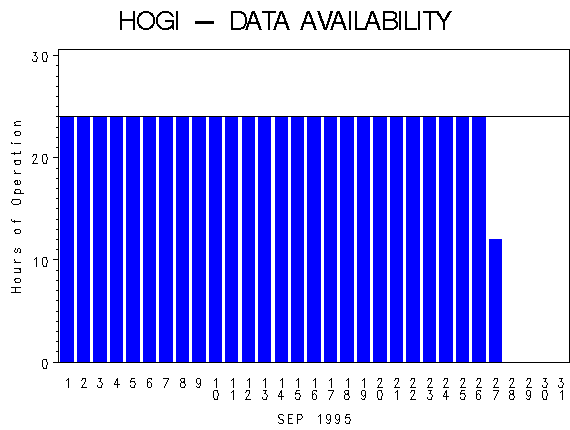 |
| Hours of Station Operation |

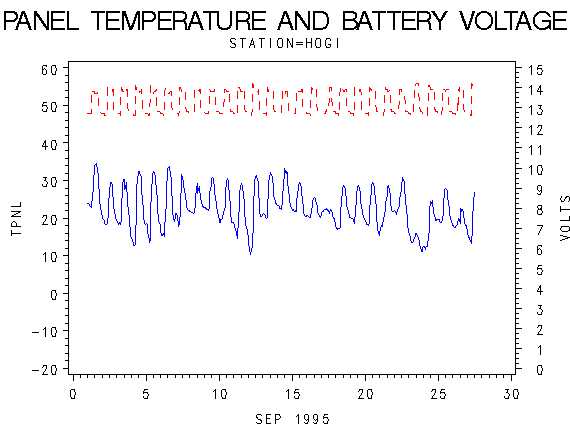 |
| Data Logger Battery Voltage and Internal Logger Temperature |
