
|
| VIRGINIA COAST RESERVE LONG-TERM ECOLOGICAL RESEARCH |
Site HOGI, Month MAR, Year 1992 |

| 
|
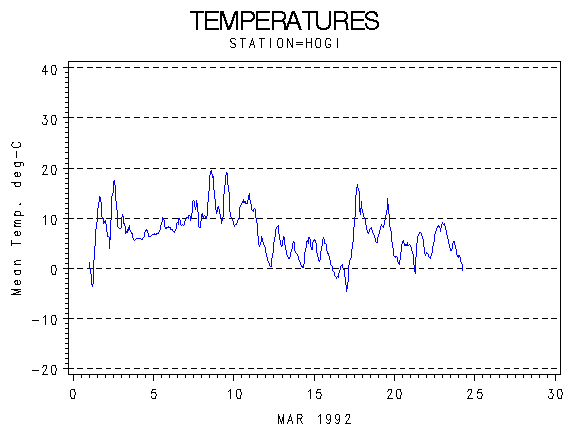
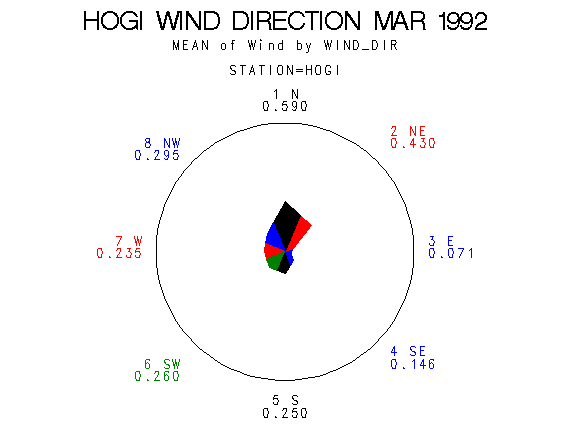
| Day of Month | Precip (mm) | Max Temp. oC | Min Temp. oC | Mean Temp. oC | Wind Speed (m/s) | Wind Dir (deg.) | Vapor Press. (mb) | Solar Rad. KJ/m2 | PAR uE/m2 |
|---|---|---|---|---|---|---|---|---|---|
| 1 | 0.00 | 15 | -4 | 6.2 | 1.62 | 228 | 5.04 | 18355 | 35266 |
| 2 | 0.00 | 18 | 3 | 10.3 | 1.28 | 186 | 7.56 | 17970 | 34516 |
| 3 | 0.00 | 11 | 5 | 7.5 | 2.83 | 49 | 8.89 | 11178 | 22918 |
| 4 | 0.00 | 8 | 6 | 6.4 | 3.24 | 55 | 8.39 | 7405 | 14935 |
| 5 | 0.00 | 11 | 7 | 7.9 | 1.75 | 60 | 9.39 | 8458 | 16566 |
| 6 | 0.00 | 10 | 7 | 8.4 | 1.70 | 119 | 10.61 | 7222 | 14182 |
| 7 | 9.70 | 15 | 8 | 10.7 | 1.55 | 182 | 11.93 | 5380 | 11116 |
| 8 | 7.20 | 20 | 8 | 13.6 | 1.42 | 294 | 12.42 | 16803 | 32496 |
| 9 | 0.00 | 20 | 9 | 12.8 | 1.35 | 209 | 11.05 | 18808 | 35712 |
| 10 | 1.50 | 16 | 8 | 11.6 | 2.54 | 174 | 11.86 | 8941 | 18565 |
| 11 | 12.70 | 15 | 4 | 8.3 | 4.14 | 258 | 8.50 | 10011 | 20153 |
| 12 | 0.00 | 9 | 0 | 4.1 | 2.77 | 277 | 3.77 | 19175 | 36925 |
| 13 | 0.00 | 7 | 2 | 3.7 | 2.50 | 348 | 4.27 | 17184 | 33363 |
| 14 | 0.00 | 7 | -0 | 3.1 | 2.11 | 294 | 3.44 | 17493 | 34321 |
| 15 | 0.00 | 7 | 0 | 3.7 | 2.70 | 346 | 4.53 | 15520 | 30716 |
| 16 | 0.00 | 2 | -3 | -0.6 | 3.71 | 347 | 2.74 | 17727 | 35440 |
| 17 | 0.00 | 17 | -5 | 7.2 | 1.86 | 222 | 5.34 | 18297 | 35801 |
| 18 | 2.50 | 12 | 5 | 7.7 | 3.00 | 59 | 7.41 | 11337 | 23530 |
| 19 | 6.10 | 15 | 2 | 8.3 | 2.69 | 331 | 10.31 | 5055 | . |
| 20 | 0.00 | 6 | 1 | 3.5 | 2.89 | 17 | 5.54 | 12616 | 2084 |
| 21 | 0.00 | 8 | -1 | 4.1 | 2.38 | 344 | 5.01 | 16596 | 660 |
| 22 | 0.00 | 9 | 2 | 5.5 | 1.78 | 127 | 5.79 | 8969 | 9679 |
| 23 | 0.50 | 9 | 2 | 5.1 | 3.22 | 339 | 5.55 | 13298 | 6999 |
| 24 | 0.00 | 3 | -1 | 1.3 | 2.29 | 351 | 3.44 | . | . |
| Mon. Tot. Precip. 40.2 mm | Mean wind vel. 2.389 m/s |
| Mon. Mean Temp. 6.7 deg. C | Wind dir 349 deg |
| Mean Max. Temp. 11.2 deg. C | Mean Min. Temp. 2.6 deg. C |
| Extreme Max. Temp 20.4 deg. C | Mean vapor press 7.20 mb |
| Extreme Min. Temp -5.0 deg. C | Total Solar Rad 303798 KJ/sq. m |
| Total photosyn. 505943 uEin/sq.m |
 |
| Daily Total Precipitation (mm) |

 |
| Hourly Mean Temperatures (deg. C) |
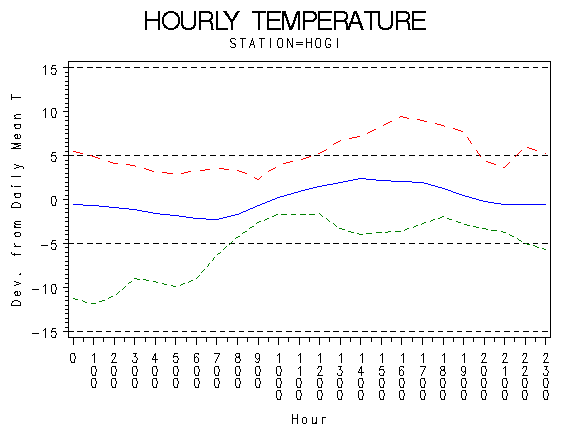 |
| Hourly Max Min and Mean Temperatures (deg. C) |
 |
| Wind Speed (m/s) |
 |
| Frequency of Wind Direction |
 |
| Wind Vectors (circle=1.5 m/s) |
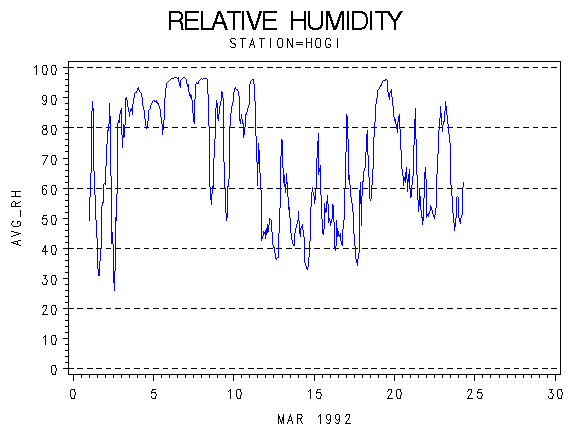 |
| Relative Humidity (percent) |
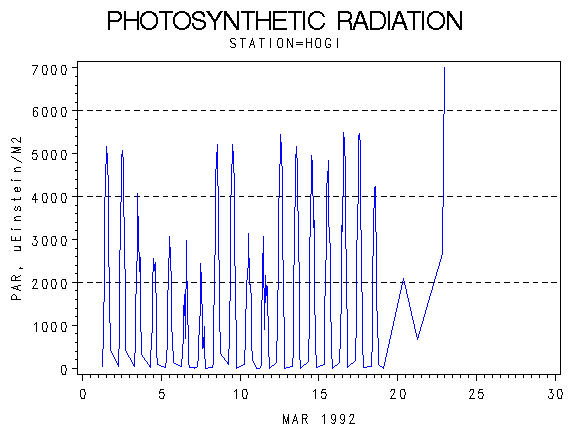 |
| Photosynthetically Active Radiation (micro-einsteins per m squared) |
 |
| Hourly Photosynthetically Active Radiation (micro-einsteins per m squared) |
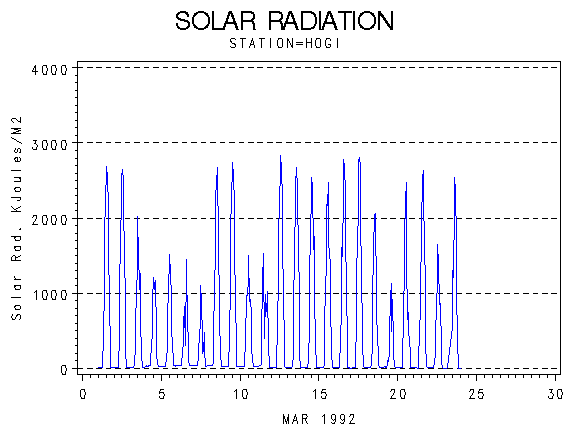 |
| Solar Radiation (KiloJoules per Meter Squared) |
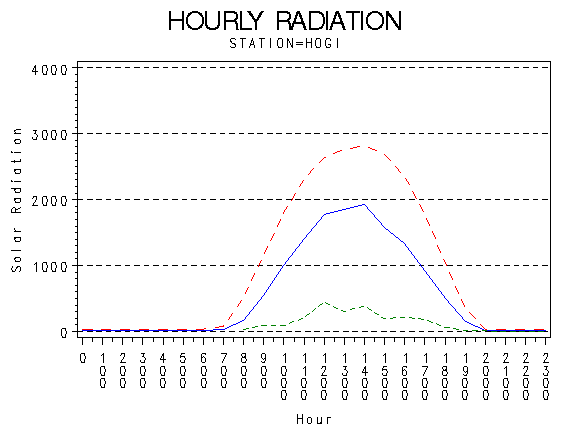 |
| Hourly Solar Radiation (KiloJoules per Meter Squared) |
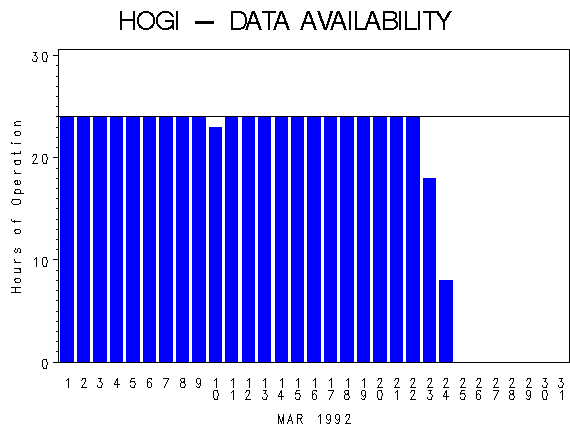 |
| Hours of Station Operation |
 |
| Data Logger Battery Voltage and Internal Logger Temperature |