

| VIRGINIA COAST RESERVE LONG-TERM ECOLOGICAL RESEARCH |
Site HOGI, Month MAY, Year 1991 |

| 
|
| Day of Month | Precip (mm) | Max Temp. oC | Min Temp. oC | Mean Temp. oC | Wind Speed (m/s) | Wind Dir (deg.) | Vapor Press. (mb) | Solar Rad. KJ/m2 | PAR uE/m2 |
|---|---|---|---|---|---|---|---|---|---|
| 1 | 0.00 | 23 | 19 | 20.8 | 2.23 | 174 | 19.98 | 22951 | 53305 |
| 2 | 0.00 | 24 | 12 | 19.7 | 2.96 | 325 | 14.12 | 24207 | 55744 |
| 3 | 0.00 | 20 | 11 | 16.3 | 2.91 | 330 | 12.33 | 21386 | 50186 |
| 4 | 0.00 | 19 | 11 | 14.8 | 1.92 | 117 | 12.84 | 22981 | 54645 |
| 5 | 0.00 | 20 | 13 | 16.7 | 1.87 | 133 | 15.18 | 20276 | 48878 |
| 6 | 1.40 | 27 | 17 | 20.7 | 2.95 | 187 | 20.61 | 16106 | 39338 |
| 7 | 0.00 | 22 | 14 | 18.0 | 2.29 | 38 | 15.70 | 21279 | 49671 |
| 8 | 0.00 | 24 | 13 | 18.5 | 1.82 | 197 | 16.60 | 24647 | 56655 |
| 9 | 1.10 | 21 | 16 | 17.5 | 3.13 | 78 | 16.99 | 6145 | 16188 |
| 10 | 0.00 | 25 | 15 | 18.9 | 2.35 | 46 | 17.77 | 14199 | 33541 |
| 11 | 0.00 | 22 | 13 | 17.5 | 1.93 | 140 | 12.91 | 25000 | 57849 |
| 12 | 0.00 | 31 | 16 | 22.0 | 1.95 | 235 | 19.42 | 23856 | 55426 |
| 13 | 0.00 | 32 | 21 | 25.2 | 1.90 | 246 | 24.51 | 22890 | 52817 |
| 14 | 0.00 | 30 | 22 | 24.1 | 2.15 | 222 | 24.88 | 22742 | 54187 |
| 15 | 0.00 | 28 | 18 | 22.4 | 1.76 | 64 | 22.95 | 23435 | 55336 |
| 16 | 0.00 | 23 | 16 | 20.0 | 1.74 | 77 | 19.82 | 26045 | 59707 |
| 17 | 0.00 | 27 | 19 | 23.1 | 2.20 | 178 | 23.94 | 23994 | 56863 |
| 18 | 0.00 | 27 | 13 | 19.4 | 4.23 | 50 | 19.52 | 13557 | 33498 |
| 19 | 0.30 | 15 | 13 | 14.1 | 5.12 | 62 | 12.53 | 8170 | 22131 |
| 20 | 0.00 | 17 | 13 | 15.0 | 3.80 | 54 | 14.47 | 11503 | 24231 |
| 21 | 0.00 | 24 | 15 | 19.0 | 1.57 | 147 | 16.71 | 27771 | 60991 |
| 22 | 0.00 | 27 | 16 | 21.1 | 2.03 | 197 | 20.50 | 26671 | 60000 |
| 23 | 0.00 | 30 | 19 | 22.9 | 1.96 | 211 | 22.54 | 26162 | 57825 |
| 24 | 0.00 | 26 | 18 | 21.8 | 2.18 | 188 | 21.24 | 25371 | 56576 |
| 25 | 0.00 | 29 | 21 | 23.5 | 2.23 | 204 | 11.53 | 25971 | 59410 |
| 26 | 0.00 | 30 | 22 | 24.8 | 2.05 | 187 | 4.70 | 26408 | 60517 |
| 27 | 0.00 | 29 | 22 | 24.2 | 2.25 | 186 | 4.78 | 24338 | 55994 |
| 28 | 0.00 | 32 | 23 | 27.5 | 1.96 | 288 | 5.11 | 20637 | 49384 |
| 29 | 0.00 | 27 | 20 | 24.7 | 1.45 | 65 | 4.58 | 26302 | 59985 |
| 30 | 0.00 | 31 | 21 | 25.2 | 2.05 | 197 | 4.75 | 24692 | 55927 |
| 31 | 1.60 | 36 | 24 | 28.4 | 1.88 | 253 | 5.09 | 22773 | 52288 |
| Mon. Tot. Precip. 4.4 mm | Mean wind vel. 2.349 m/s |
| Mon. Mean Temp. 20.9 deg. C | Wind dir 160 deg |
| Mean Max. Temp. 25.7 deg. C | Mean Min. Temp. 16.9 deg. C |
| Extreme Max. Temp 35.9 deg. C | Mean vapor press 15.44 mb |
| Extreme Min. Temp 10.6 deg. C | Total Solar Rad 672467 KJ/sq. m |
| Total photosyn. 1559091 uEin/sq.m |
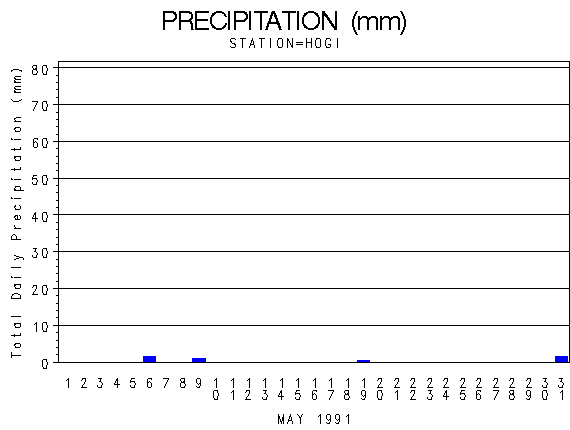 |
| Daily Total Precipitation (mm) |

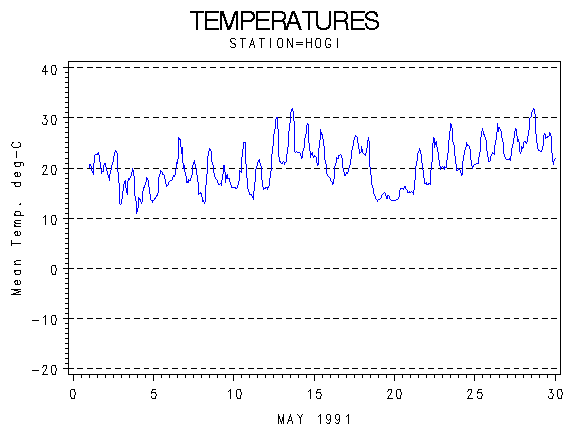 |
| Hourly Mean Temperatures (deg. C) |

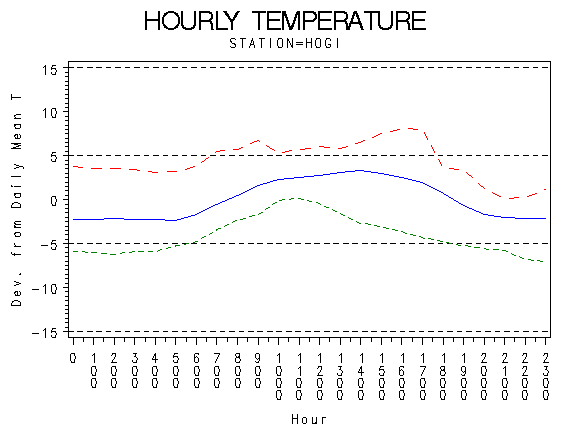 |
| Hourly Max Min and Mean Temperatures (deg. C) |

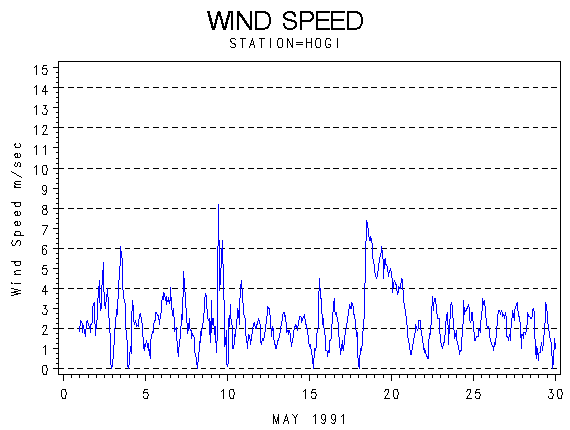 |
| Wind Speed (m/s) |

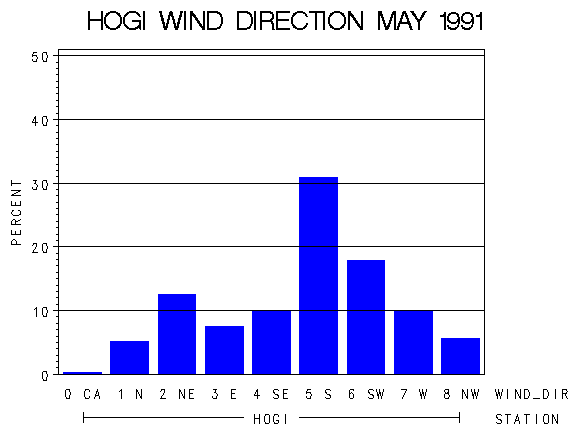 |
| Frequency of Wind Direction |

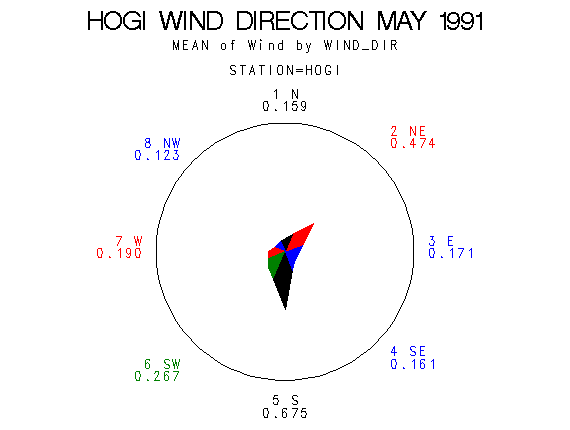 |
| Wind Vectors (circle=1.5 m/s) |

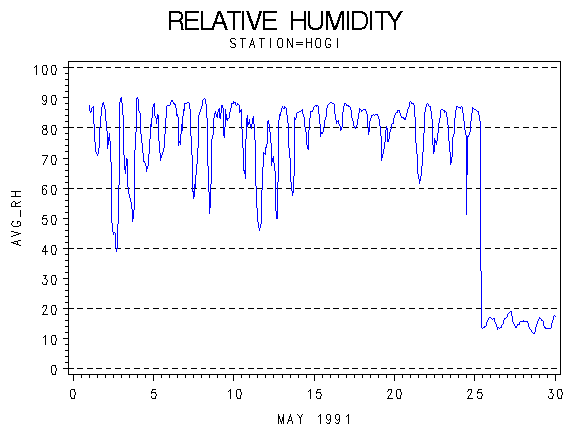 |
| Relative Humidity (percent) |

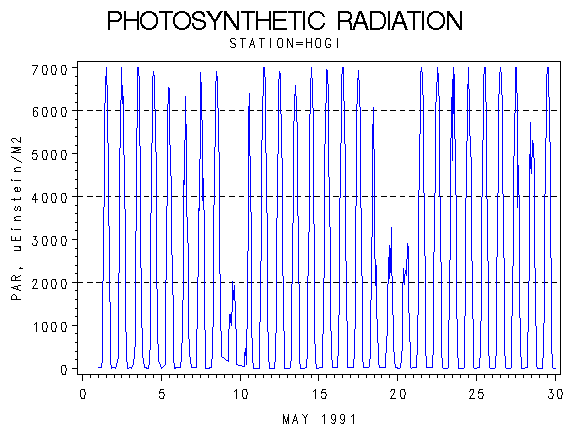 |
| Photosynthetically Active Radiation (micro-einsteins per m squared) |

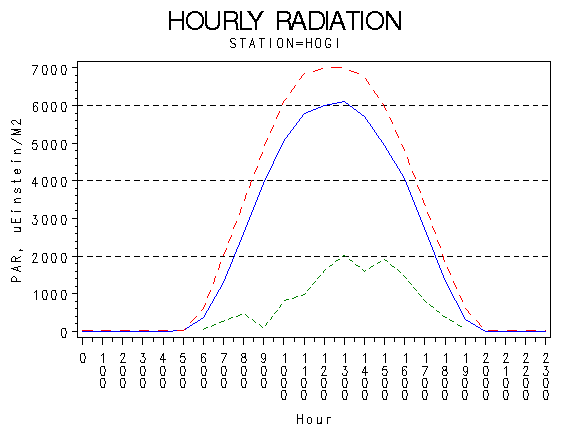 |
| Hourly Photosynthetically Active Radiation (micro-einsteins per m squared) |

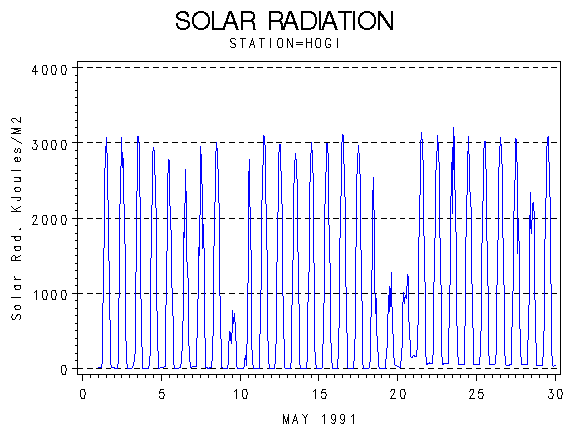 |
| Solar Radiation (KiloJoules per Meter Squared) |

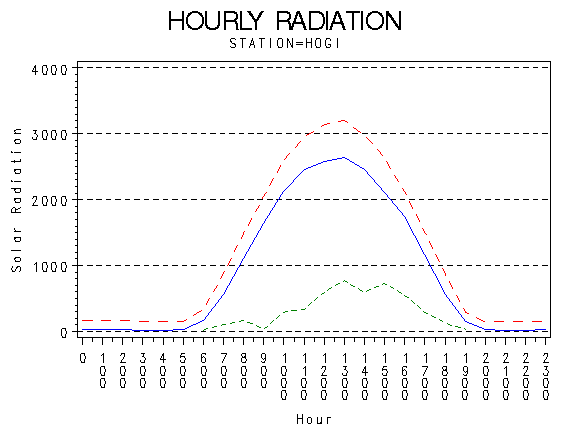 |
| Hourly Solar Radiation (KiloJoules per Meter Squared) |

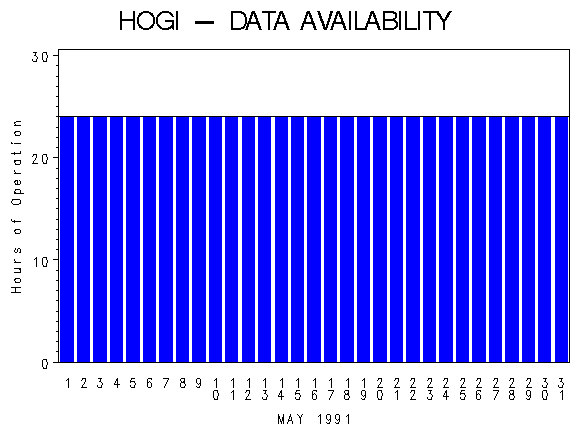 |
| Hours of Station Operation |

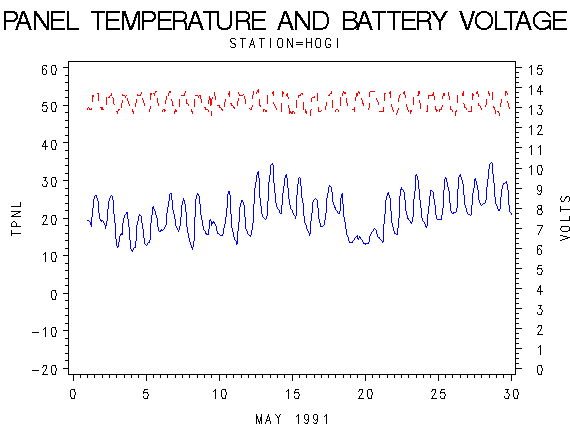 |
| Data Logger Battery Voltage and Internal Logger Temperature |
