

| VIRGINIA COAST RESERVE LONG-TERM ECOLOGICAL RESEARCH |
Site HOGI, Month SEP, Year 1989 |

| 
|
| Day of Month | Precip (mm) | Max Temp. oC | Min Temp. oC | Mean Temp. oC | Wind Speed (m/s) | Wind Dir (deg.) | Vapor Press. (mb) | Solar Rad. KJ/m2 | PAR uE/m2 |
|---|---|---|---|---|---|---|---|---|---|
| 1 | 0.00 | 28 | 19 | 24.6 | 3.04 | 190 | 25.11 | 21428 | 49655 |
| 2 | 0.00 | 29 | 23 | 25.7 | 2.33 | 248 | 27.33 | 13829 | 33215 |
| 3 | 0.00 | 26 | 20 | 22.7 | 5.08 | 39 | 20.54 | 19394 | 45153 |
| 4 | 0.00 | 25 | 21 | 22.5 | 5.26 | 64 | 18.68 | 15692 | 37990 |
| 5 | 0.00 | 26 | 22 | 23.1 | 4.42 | 60 | 23.14 | 18129 | 51649 |
| 6 | 0.00 | 25 | 20 | 22.5 | 3.80 | 54 | 22.25 | 17037 | 47248 |
| 7 | 0.00 | 25 | 18 | 21.7 | 3.18 | 43 | 21.91 | 18855 | 51953 |
| 8 | 0.00 | 25 | 18 | 21.4 | 1.85 | 52 | 21.33 | 20359 | 51943 |
| 9 | 0.00 | 29 | 18 | 22.7 | 1.42 | 192 | 21.33 | 18084 | 50931 |
| 10 | 0.00 | 29 | 21 | 24.6 | 1.98 | 194 | 25.76 | 19431 | 68114 |
| 11 | 0.00 | 31 | 22 | 26.1 | 1.78 | 196 | 27.83 | 18552 | 63274 |
| 12 | 0.00 | 27 | 23 | 24.5 | 2.15 | 67 | 25.46 | 12923 | 38756 |
| 13 | 0.00 | 28 | 23 | 24.7 | 1.68 | 120 | 25.69 | 16498 | 48736 |
| 14 | 0.00 | 27 | 23 | 24.6 | 2.72 | 165 | 25.60 | 7755 | 26830 |
| 15 | 0.00 | 30 | 23 | 25.2 | 2.14 | 215 | 26.52 | 13314 | 32614 |
| 16 | 0.00 | 29 | 22 | 25.0 | 2.73 | 189 | 26.26 | 15144 | 35576 |
| 17 | 0.00 | 28 | 19 | 24.0 | 2.01 | 280 | 23.76 | 13091 | 30979 |
| 18 | 0.00 | 25 | 19 | 21.8 | 4.13 | 41 | 21.97 | 10247 | 25170 |
| 19 | 0.00 | 26 | 21 | 22.7 | 5.56 | 72 | 23.16 | 8291 | 24676 |
| 20 | 0.00 | 29 | 23 | 25.0 | 2.31 | 140 | 26.28 | 14067 | 35724 |
| 21 | 0.00 | 28 | 24 | 25.5 | 2.20 | 102 | 26.97 | 18910 | 46540 |
| 22 | 0.00 | 28 | 24 | 25.9 | 4.81 | 157 | 27.58 | 15531 | 81288 |
| 23 | 0.00 | 28 | 12 | 23.0 | 5.10 | 252 | 23.50 | 12143 | 72024 |
| 24 | 0.00 | 18 | 11 | 14.3 | 5.06 | 11 | 10.52 | 20027 | 45927 |
| 25 | 0.00 | 22 | 13 | 18.6 | 3.33 | 76 | 16.87 | 9037 | 26872 |
| 26 | 0.00 | 24 | 19 | 21.3 | 3.65 | 346 | 20.69 | 10657 | 25241 |
| 27 | 0.00 | 19 | 13 | 15.4 | 5.29 | 23 | 11.51 | 19836 | 43165 |
| 28 | 0.00 | 20 | 12 | 16.0 | 1.97 | 63 | 12.92 | 18937 | 42271 |
| 29 | 0.00 | 24 | 16 | 19.4 | 1.78 | 223 | 18.49 | 9708 | 23772 |
| 30 | 0.00 | 21 | 18 | 19.6 | 2.61 | 45 | 18.98 | 5991 | 16051 |
| Mon. Tot. Precip. 0.0 mm | Mean wind vel. 3.179 m/s |
| Mon. Mean Temp. 22.5 deg. C | Wind dir 74 deg |
| Mean Max. Temp. 26.0 deg. C | Mean Min. Temp. 19.3 deg. C |
| Extreme Max. Temp 31.4 deg. C | Mean vapor press 22.27 mb |
| Extreme Min. Temp 11.2 deg. C | Total Solar Rad 452895 KJ/sq. m |
| Total photosyn. 1273337 uEin/sq.m |
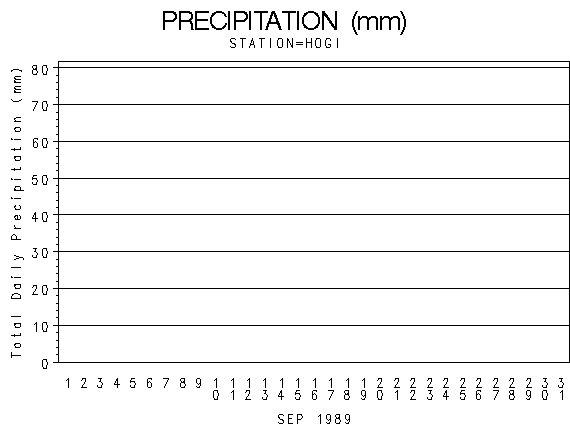 |
| Daily Total Precipitation (mm) |

 |
| Hourly Mean Temperatures (deg. C) |

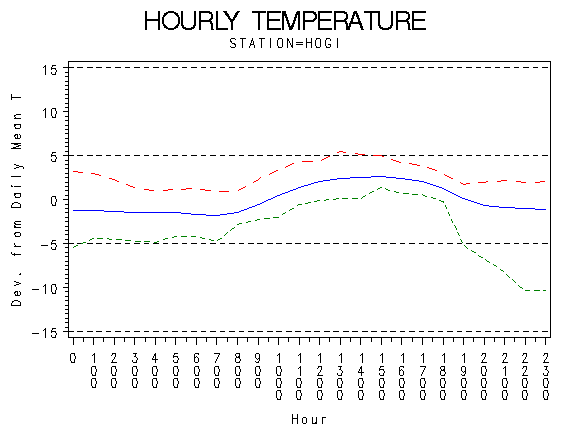 |
| Hourly Max Min and Mean Temperatures (deg. C) |

 |
| Wind Speed (m/s) |

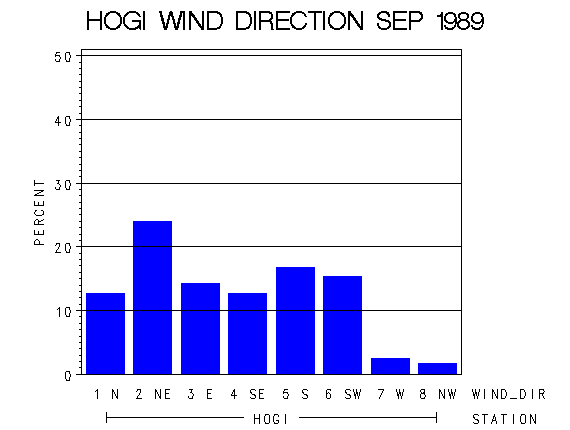 |
| Frequency of Wind Direction |

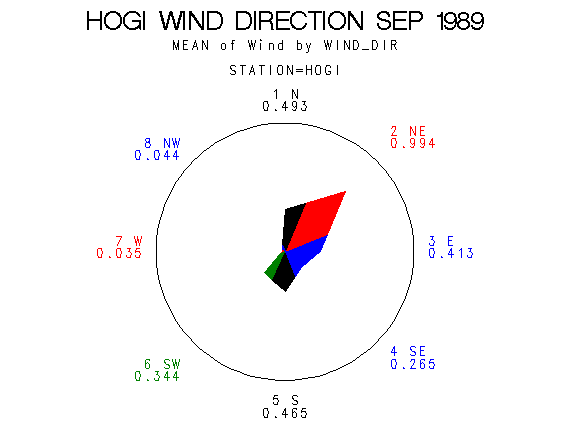 |
| Wind Vectors (circle=1.5 m/s) |

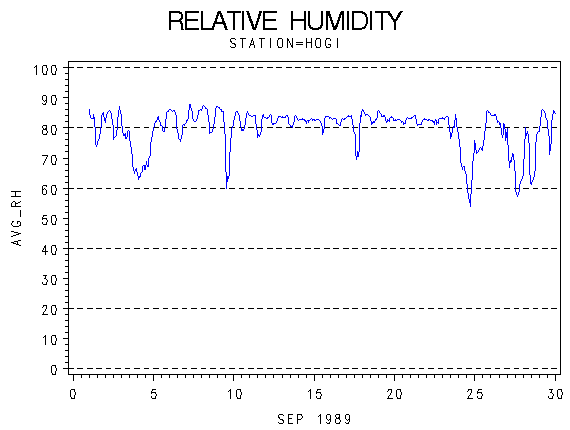 |
| Relative Humidity (percent) |

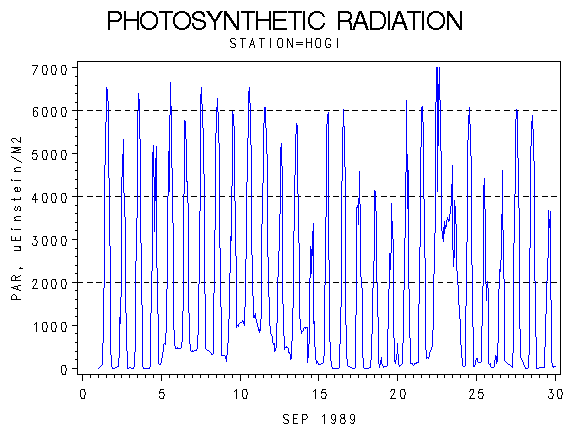 |
| Photosynthetically Active Radiation (micro-einsteins per m squared) |

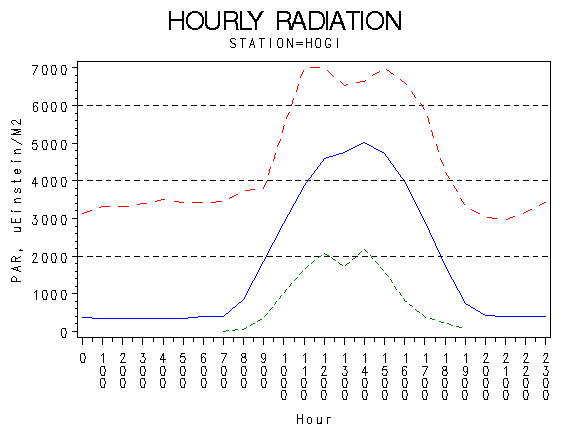 |
| Hourly Photosynthetically Active Radiation (micro-einsteins per m squared) |

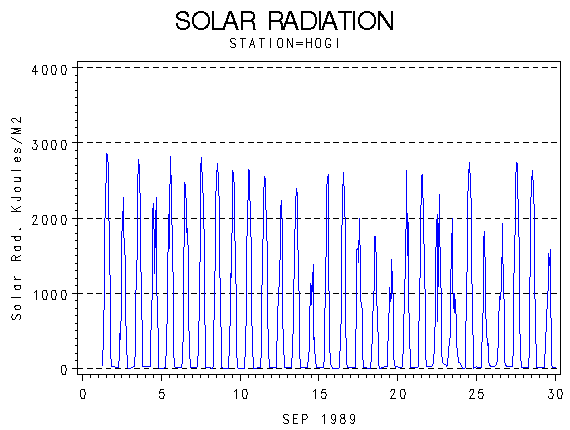 |
| Solar Radiation (KiloJoules per Meter Squared) |

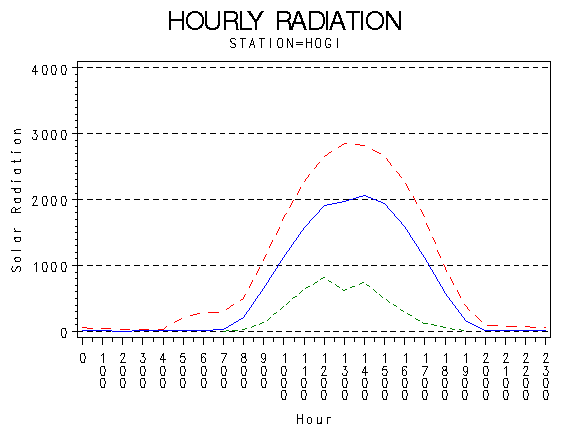 |
| Hourly Solar Radiation (KiloJoules per Meter Squared) |

 |
| Hours of Station Operation |

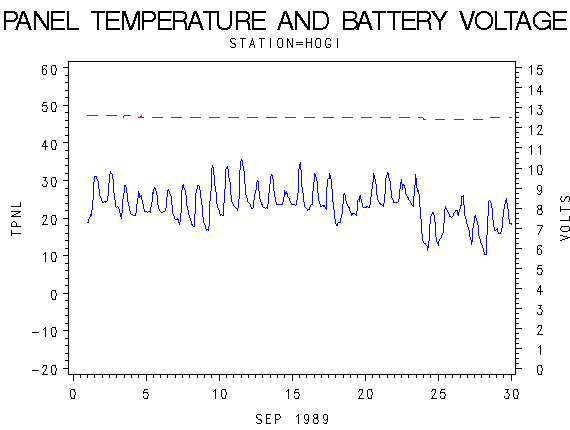 |
| Data Logger Battery Voltage and Internal Logger Temperature |
