

| VIRGINIA COAST RESERVE LONG-TERM ECOLOGICAL RESEARCH |
Site BRNV, Month APR, Year 1991 |

| 
|
| Day of Month | Precip (mm) | Max Temp. oC | Min Temp. oC | Mean Temp. oC | Wind Speed (m/s) | Wind Dir (deg.) | Vapor Press. (mb) | Solar Rad. KJ/m2 | PAR uE/m2 |
|---|---|---|---|---|---|---|---|---|---|
| 1 | 0.00 | 17 | -0 | 8.5 | 0.92 | 301 | 2.69 | 22417 | 34305 |
| 2 | 0.00 | 16 | 1 | 8.5 | 0.83 | 341 | 2.51 | 24111 | 36455 |
| 3 | 0.00 | 13 | -1 | 6.5 | 0.89 | 42 | 2.32 | 24825 | 37446 |
| 4 | 0.00 | 16 | 5 | 10.6 | 0.90 | 149 | 2.81 | 24728 | 37442 |
| 5 | 0.00 | 19 | 11 | 15.1 | 1.75 | 212 | 3.93 | 8111 | 12879 |
| 6 | 0.00 | 25 | 12 | 17.8 | 1.38 | 260 | 4.32 | 23666 | 35560 |
| 7 | 0.00 | 29 | 11 | 19.7 | 1.11 | 221 | 4.86 | 24530 | 36812 |
| 8 | 0.00 | 29 | 18 | 21.7 | 2.25 | 220 | 5.18 | 23154 | 33851 |
| 9 | 0.00 | 28 | 19 | 22.8 | 2.72 | 225 | 5.94 | 18030 | 26232 |
| 10 | 0.00 | 25 | 14 | 20.9 | 1.79 | 261 | 4.78 | 20002 | 29153 |
| 11 | 0.00 | 18 | 5 | 11.3 | 2.19 | 336 | 2.64 | 26388 | 37922 |
| 12 | 0.00 | 14 | 5 | 9.1 | 1.08 | 78 | 2.49 | 25203 | 37588 |
| 13 | 0.00 | 15 | 8 | 11.8 | 1.03 | 145 | 3.28 | 6073 | 9842 |
| 14 | 0.00 | 15 | 10 | 12.0 | 1.93 | 69 | 3.97 | 3832 | 6495 |
| 15 | 0.00 | 21 | 10 | 15.6 | 1.08 | 144 | 4.83 | 13190 | 20168 |
| 16 | 0.80 | 23 | 15 | 19.4 | 1.08 | 196 | 5.85 | 26304 | 38948 |
| 17 | 0.00 | 26 | 13 | 19.4 | 2.11 | 215 | 4.90 | 23870 | 34753 |
| 18 | 0.30 | 21 | 9 | 12.2 | 1.94 | 40 | 3.53 | 9786 | 14534 |
| 19 | 0.00 | 12 | 8 | 9.6 | 2.25 | 84 | 2.89 | 16894 | 25758 |
| 20 | 60.30 | 14 | 10 | 11.8 | 2.66 | 56 | 5.18 | 1719 | 3377 |
| 21 | 22.40 | 16 | 10 | 12.2 | 2.28 | 327 | 5.45 | 7293 | 10938 |
| 22 | 0.30 | 18 | 8 | 12.3 | 1.22 | 254 | 3.34 | 22820 | 33832 |
| 23 | 0.00 | 19 | 6 | 12.9 | 0.75 | 184 | 3.34 | 26783 | 39401 |
| 24 | 2.80 | 24 | 9 | 15.3 | 1.49 | 302 | 4.06 | 19587 | 28415 |
| 25 | 0.00 | 22 | 9 | 14.7 | 1.51 | 319 | 3.45 | 26351 | 38363 |
| 26 | 0.00 | 21 | 7 | 15.4 | 0.61 | 159 | 4.12 | 25288 | 37718 |
| 27 | 0.00 | 25 | 16 | 19.9 | 1.80 | 216 | 5.27 | 24120 | 34291 |
| 28 | 0.00 | 22 | 18 | 19.2 | 1.16 | 220 | 5.14 | 2953 | 4411 |
| Mon. Tot. Precip. 86.9 mm | Mean wind vel. 1.524 m/s |
| Mon. Mean Temp. 14.5 deg. C | Wind dir 236 deg |
| Mean Max. Temp. 20.1 deg. C | Mean Min. Temp. 9.4 deg. C |
| Extreme Max. Temp 29.4 deg. C | Mean vapor press 4.04 mb |
| Extreme Min. Temp -0.6 deg. C | Total Solar Rad 522024 KJ/sq. m |
| Total photosyn. 776887 uEin/sq.m |
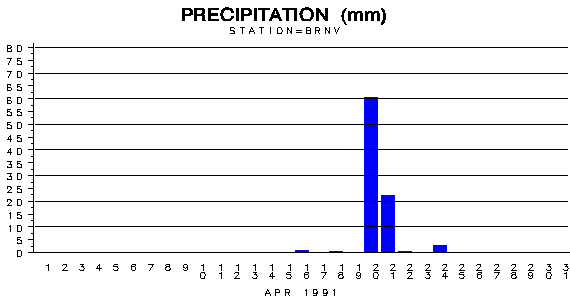 |
| Daily Total Precipitation (mm) |

 |
| Hourly Mean Temperatures (deg. C) |

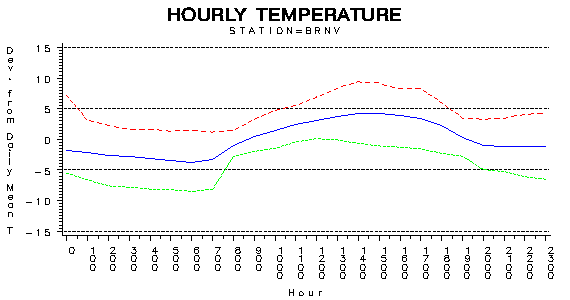 |
| Hourly Max Min and Mean Temperatures (deg. C) |

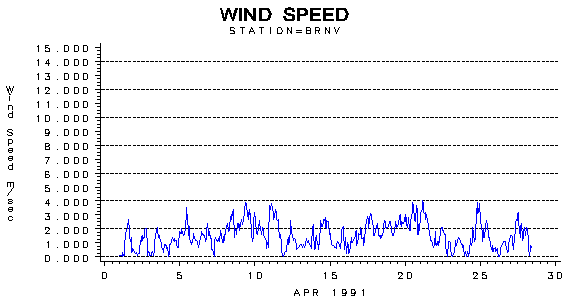 |
| Wind Speed (m/s) |

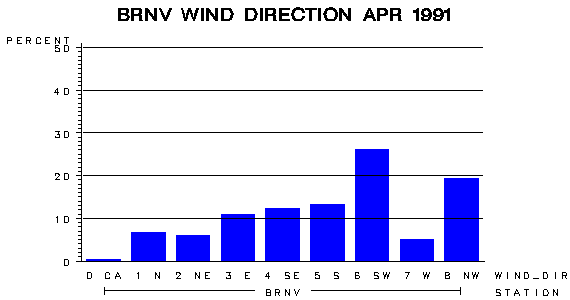 |
| Frequency of Wind Direction |

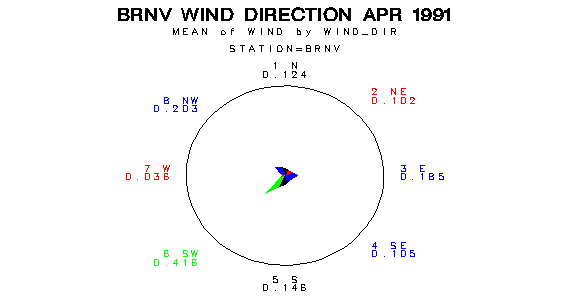 |
| Wind Vectors (circle=1.5 m/s) |

 |
| Relative Humidity (percent) |

 |
| Photosynthetically Active Radiation (micro-einsteins per m squared) |

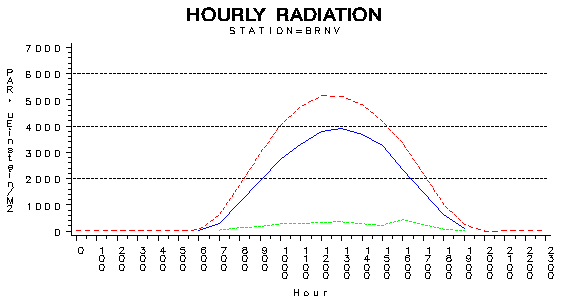 |
| Hourly Photosynthetically Active Radiation (micro-einsteins per m squared) |

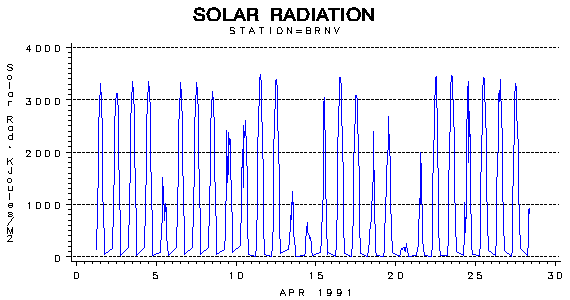 |
| Solar Radiation (KiloJoules per Meter Squared) |

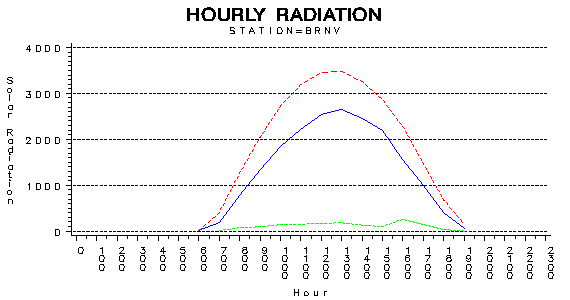 |
| Hourly Solar Radiation (KiloJoules per Meter Squared) |

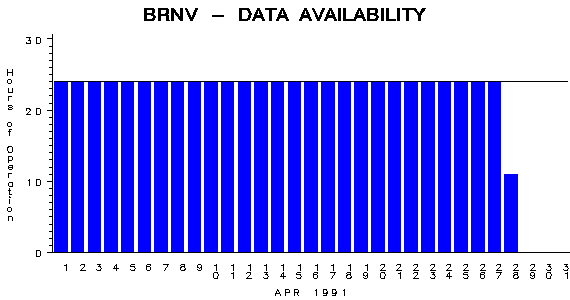 |
| Hours of Station Operation |

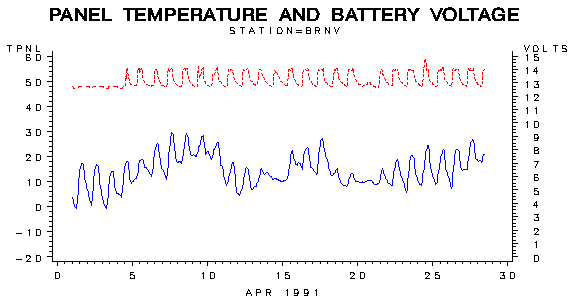 |
| Data Logger Battery Voltage and Internal Logger Temperature |
