
|
| VIRGINIA COAST RESERVE LONG-TERM ECOLOGICAL RESEARCH |
Site PHCK, Month JUN, Year 1999 |

| 
|
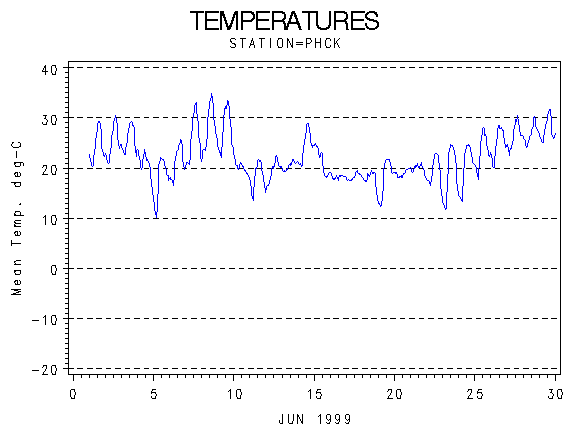
| Day of Month | Precip (mm) | Max Temp. oC | Min Temp. oC | Mean Temp. oC | Wind Speed (m/s) | Wind Dir (deg.) | Vapor Press. (mb) | Solar Rad. KJ/m2 | PAR uE/m2 |
|---|---|---|---|---|---|---|---|---|---|
| 1 | 0.00 | 30 | 20 | 24.4 | 2.52 | 203 | 21.06 | 27460 | 44088 |
| 2 | 0.00 | 31 | 21 | 25.2 | 4.00 | 197 | 22.06 | 28055 | 45208 |
| 3 | 0.00 | 30 | 22 | 25.7 | 3.43 | 214 | 22.28 | 21888 | 36598 |
| 4 | 0.00 | 24 | 15 | 20.8 | 1.49 | 346 | 17.02 | 23042 | 37320 |
| 5 | 0.00 | 22 | 10 | 17.7 | 1.29 | 36 | 16.21 | 27957 | 45030 |
| 6 | 0.00 | 26 | 15 | 21.2 | 0.75 | 33 | 21.44 | 28052 | 45854 |
| 7 | 0.00 | 34 | 20 | 26.1 | 2.17 | 147 | 23.69 | 27723 | 45646 |
| 8 | 0.00 | 35 | 21 | 28.1 | 1.79 | 237 | 25.59 | 25697 | 41840 |
| 9 | 0.00 | 34 | 22 | 27.7 | 0.64 | 2 | 24.64 | 27679 | 44002 |
| 10 | 0.00 | 24 | 18 | 20.1 | 2.94 | 27 | 20.89 | 8350 | 14543 |
| 11 | 0.00 | 22 | 13 | 18.3 | 2.27 | 20 | 17.58 | 23242 | 37049 |
| 12 | 5.33 | 23 | 15 | 19.3 | 2.76 | 5 | 21.07 | 7336 | 13772 |
| 13 | 32.77 | 22 | 19 | 20.4 | 2.03 | 300 | 23.32 | 6560 | 13098 |
| 14 | 0.76 | 30 | 20 | 24.5 | 1.62 | 171 | 26.64 | 25652 | 44968 |
| 15 | 12.70 | 25 | 18 | 21.4 | 1.90 | 306 | 23.73 | 3550 | 7652 |
| 16 | 9.14 | 19 | 17 | 18.3 | 2.77 | 22 | 19.57 | 4919 | 10140 |
| 17 | 2.79 | 20 | 17 | 18.3 | 2.07 | 69 | 19.69 | 4901 | 9703 |
| 18 | 0.00 | 20 | 13 | 17.8 | 1.20 | 115 | 18.05 | 7298 | 12930 |
| 19 | 0.00 | 22 | 12 | 18.2 | 2.20 | 86 | 17.06 | 29335 | 48102 |
| 20 | 23.88 | 20 | 18 | 18.9 | 2.46 | 59 | 20.81 | 3165 | 6486 |
| 21 | 0.25 | 21 | 18 | 19.8 | 1.60 | 144 | 22.23 | 7692 | 13579 |
| 22 | 0.00 | 24 | 14 | 19.3 | 2.32 | 121 | 17.73 | 28329 | 45058 |
| 23 | 0.00 | 25 | 12 | 18.9 | 0.75 | 91 | 16.07 | 29516 | 46429 |
| 24 | 0.00 | 25 | 13 | 20.2 | 0.23 | 101 | 20.56 | 26779 | 42800 |
| 25 | 0.00 | 29 | 17 | 23.3 | 0.24 | 273 | 24.47 | 18832 | 31828 |
| 26 | 0.00 | 29 | 20 | 25.0 | 0.22 | 143 | 27.81 | 28030 | 45623 |
| 27 | 0.00 | 31 | 22 | 26.5 | 1.08 | 126 | 30.82 | 19523 | 31663 |
| 28 | 0.00 | 31 | 24 | 26.8 | 2.79 | 178 | 29.61 | 14843 | 24696 |
| 29 | 0.00 | 32 | 25 | 27.7 | 3.23 | 297 | 30.61 | 23676 | 41163 |
| 30 | 0.00 | 29 | 25 | 25.8 | 0.44 | 263 | 30.29 | 8785 | 17199 |
| Mon. Tot. Precip. 87.6 mm | Mean wind vel. 1.840 m/s |
| Mon. Mean Temp. 22.2 deg. C | Wind dir 101 deg |
| Mean Max. Temp. 26.4 deg. C | Mean Min. Temp. 17.8 deg. C |
| Extreme Max. Temp 35.5 deg. C | Mean vapor press 22.42 mb |
| Extreme Min. Temp 10.0 deg. C | Total Solar Rad 567867 KJ/sq. m |
| Total photosyn. 944065 uEin/sq.m |
 |
| Daily Total Precipitation (mm) |

 |
| Hourly Mean Temperatures (deg. C) |
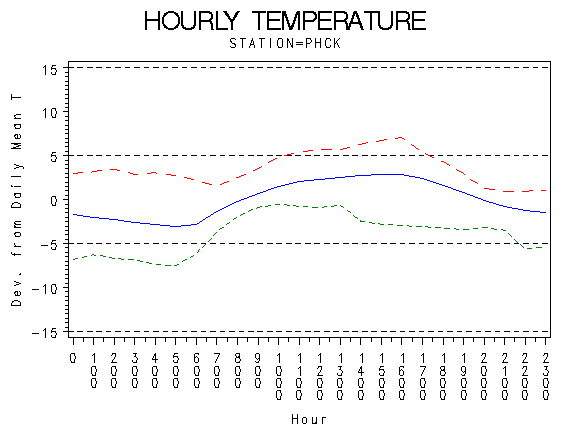 |
| Hourly Max Min and Mean Temperatures (deg. C) |
 |
| Wind Speed (m/s) |
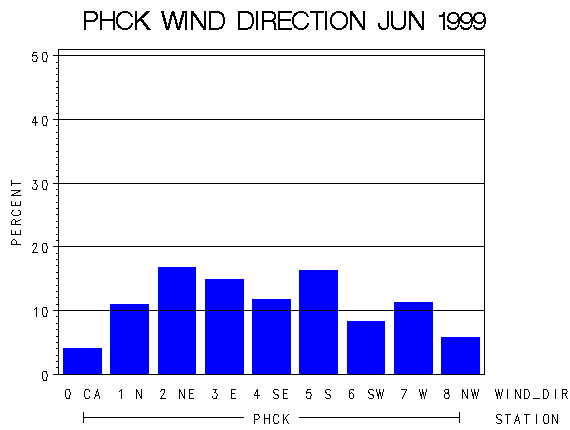 |
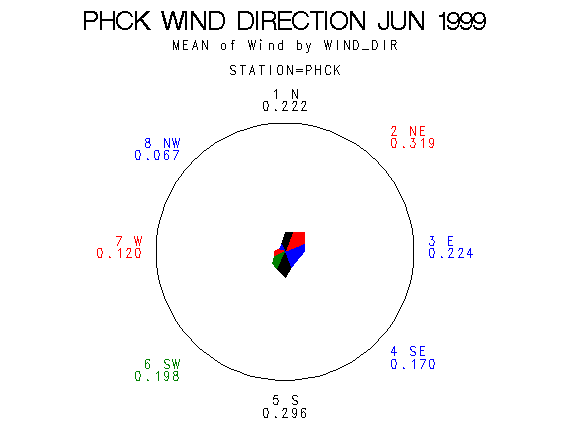
| Frequency of Wind Direction |
 |
| Wind Vectors (circle=1.5 m/s) |
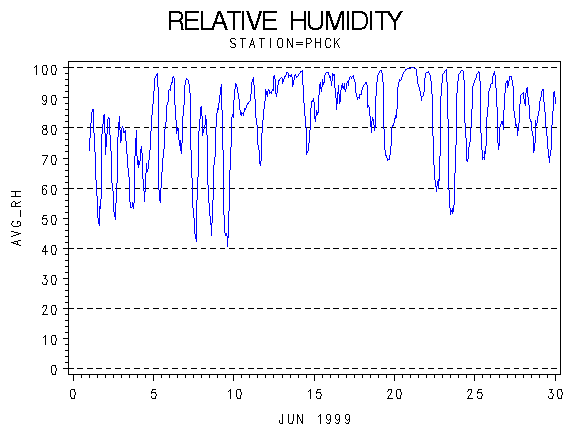 |
| Relative Humidity (percent) |
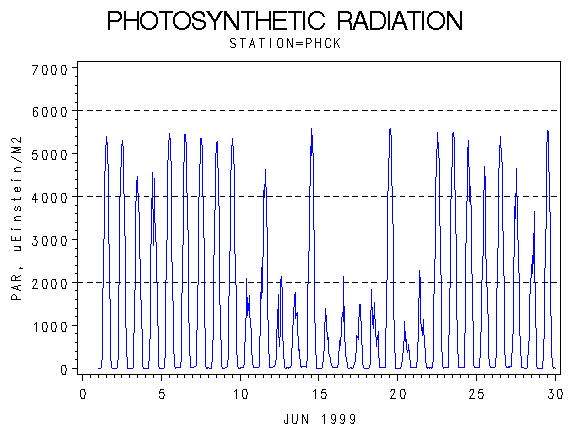 |
| Photosynthetically Active Radiation (micro-einsteins per m squared) |
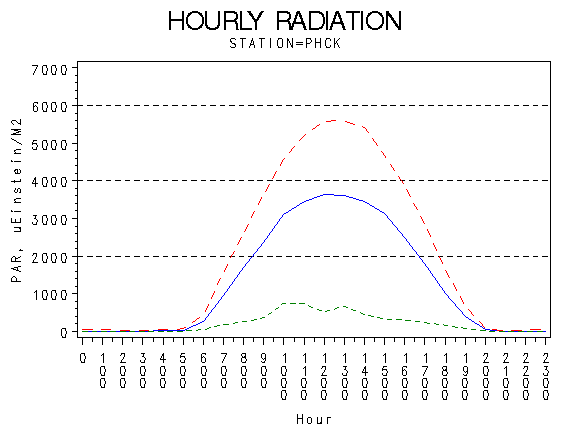 |
| Hourly Photosynthetically Active Radiation (micro-einsteins per m squared) |
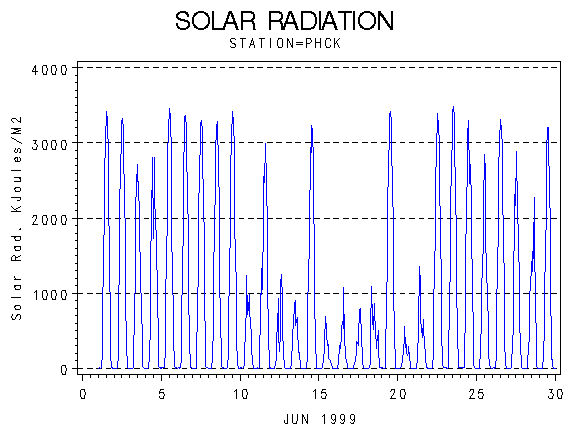 |
| Solar Radiation (KiloJoules per Meter Squared) |
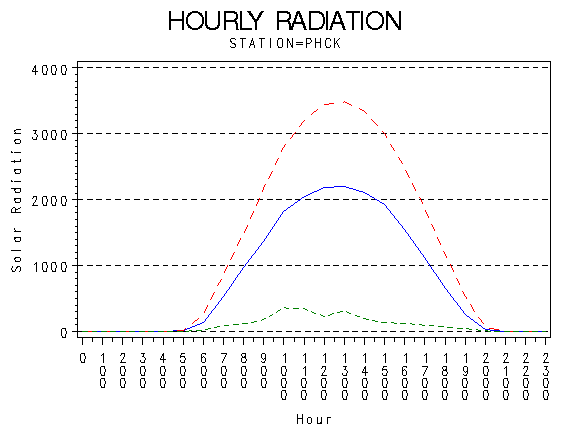 |
| Hourly Solar Radiation (KiloJoules per Meter Squared) |
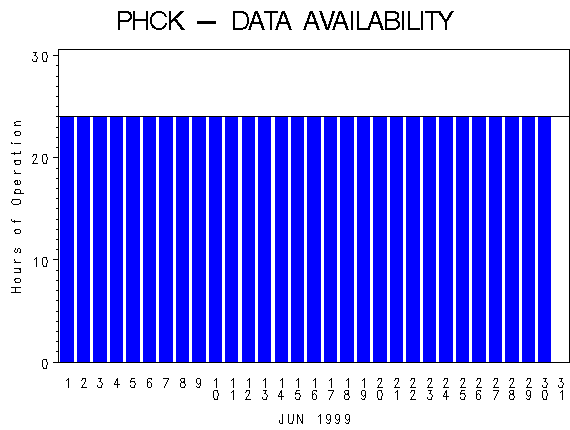 |
| Hours of Station Operation |
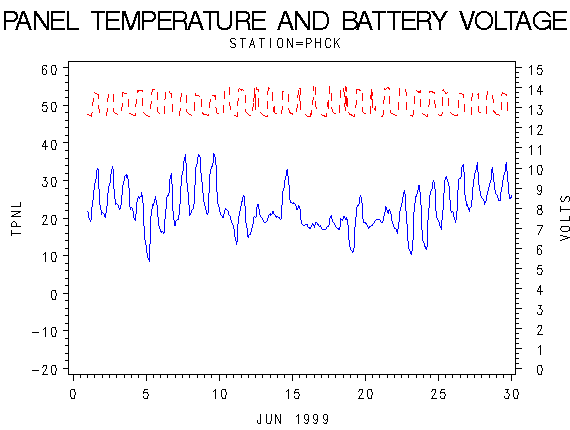 |
| Data Logger Battery Voltage and Internal Logger Temperature |