

| VIRGINIA COAST RESERVE LONG-TERM ECOLOGICAL RESEARCH |
Site PHCK, Month NOV, Year 1998 |

| 
|
| Day of Month | Precip (mm) | Max Temp. oC | Min Temp. oC | Mean Temp. oC | Wind Speed (m/s) | Wind Dir (deg.) | Vapor Press. (mb) | Solar Rad. KJ/m2 | PAR uE/m2 |
|---|---|---|---|---|---|---|---|---|---|
| 1 | 0.00 | 16 | 3 | 9.9 | 1.10 | 342 | 8.86 | 13146 | 20049 |
| 2 | 0.25 | 16 | 5 | 10.5 | 0.77 | 324 | 9.90 | 7781 | 12314 |
| 3 | 15.49 | 11 | 6 | 8.1 | 1.49 | 25 | 10.20 | 1251 | 2320 |
| 4 | 0.00 | 10 | 3 | 7.0 | 1.57 | 11 | 7.59 | 3130 | 5024 |
| 5 | 0.00 | 10 | 2 | 5.2 | 1.48 | 7 | 5.88 | 12592 | 18525 |
| 6 | 0.00 | 10 | 4 | 6.9 | 2.43 | 348 | 6.45 | 10141 | 15400 |
| 7 | 0.00 | 12 | 3 | 7.6 | 1.39 | 310 | 6.68 | 12520 | 18789 |
| 8 | 0.00 | 10 | 1 | 6.6 | 0.38 | 273 | 8.20 | 3403 | 5765 |
| 9 | 0.00 | 14 | 4 | 8.8 | 0.26 | 74 | 9.18 | 8033 | 12484 |
| 10 | 0.00 | 18 | 3 | 12.1 | 0.65 | 178 | 13.40 | 6950 | 10997 |
| 11 | 9.65 | 21 | 8 | 15.0 | 2.35 | 237 | 16.23 | 3005 | 4970 |
| 12 | 0.25 | 14 | 2 | 7.4 | 0.94 | 354 | 7.40 | 11889 | 17677 |
| 13 | 0.00 | 14 | 2 | 6.9 | 0.33 | 257 | 8.45 | 4982 | 7580 |
| 14 | 0.00 | 15 | 2 | 9.3 | 1.54 | 228 | 9.77 | 4241 | 6648 |
| 15 | 0.00 | 21 | 7 | 14.0 | 2.45 | 267 | 12.39 | 11280 | 16451 |
| 16 | 0.00 | 16 | 4 | 11.3 | 0.86 | 73 | 10.91 | 10617 | 16093 |
| 17 | 0.00 | 19 | 12 | 15.7 | 2.29 | 312 | 13.98 | 10499 | 15957 |
| 18 | 0.00 | 13 | 2 | 8.9 | 1.25 | 7 | 8.59 | 10275 | 15494 |
| 19 | 0.00 | 16 | 1 | 9.7 | 0.33 | 159 | 11.33 | 9347 | 14677 |
| 20 | 2.29 | 21 | 11 | 16.6 | 2.00 | 239 | 16.96 | 5979 | 9495 |
| 21 | 0.25 | 13 | 4 | 9.0 | 2.16 | 330 | 7.80 | 10358 | 15670 |
| 22 | 0.00 | 11 | -2 | 4.2 | 0.53 | 293 | 6.44 | 10732 | 16061 |
| 23 | 0.00 | 19 | 1 | 11.8 | 2.65 | 227 | 9.84 | 10574 | 16000 |
| 24 | 0.00 | 18 | 3 | 13.4 | 2.40 | 303 | 9.62 | 10239 | 14925 |
| 25 | 0.00 | 15 | 1 | 9.5 | 0.47 | 69 | 8.70 | 9265 | 14726 |
| 26 | 11.18 | 18 | 12 | 14.2 | 2.87 | 261 | 11.14 | 9553 | 15587 |
| 27 | 0.00 | 15 | 2 | 10.6 | 2.20 | 297 | 7.44 | 10318 | 16650 |
| 28 | 0.00 | 19 | 1 | 9.4 | 1.17 | 235 | 8.69 | 10197 | 16883 |
| 29 | 0.00 | 21 | 3 | 11.3 | 0.38 | 231 | 10.15 | 10078 | 16513 |
| 30 | 0.00 | 23 | 5 | 13.6 | 1.42 | 218 | 13.64 | 8210 | 13738 |
| Mon. Tot. Precip. 39.4 mm | Mean wind vel. 1.405 m/s |
| Mon. Mean Temp. 10.2 deg. C | Wind dir 294 deg |
| Mean Max. Temp. 15.7 deg. C | Mean Min. Temp. 3.8 deg. C |
| Extreme Max. Temp 23.0 deg. C | Mean vapor press 9.86 mb |
| Extreme Min. Temp -2.0 deg. C | Total Solar Rad 260586 KJ/sq. m |
| Total photosyn. 403462 uEin/sq.m |
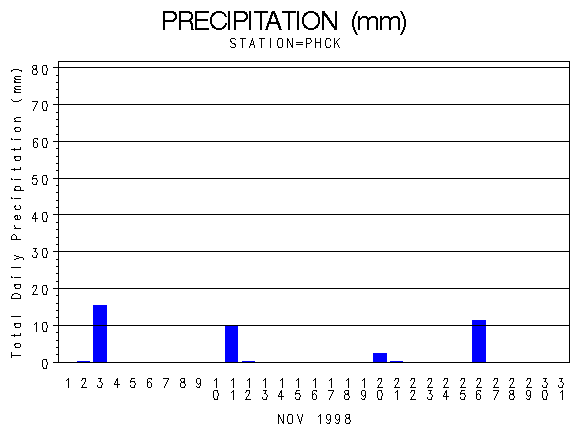 |
| Daily Total Precipitation (mm) |

 |
| Hourly Mean Temperatures (deg. C) |

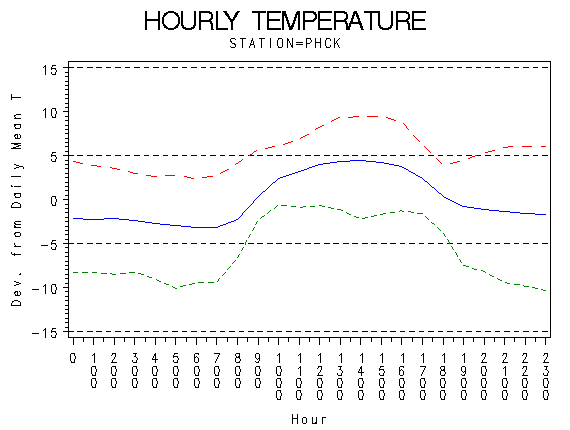 |
| Hourly Max Min and Mean Temperatures (deg. C) |

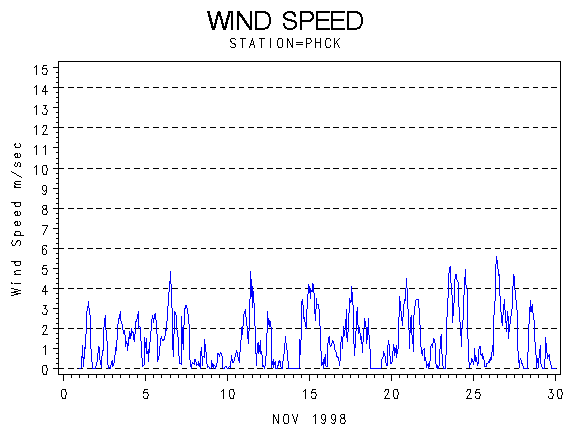 |
| Wind Speed (m/s) |

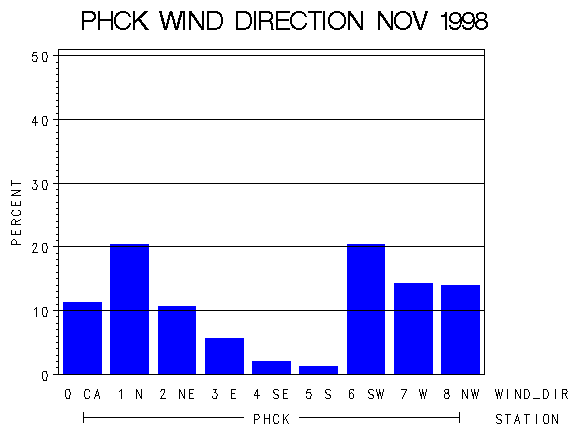 |
| Frequency of Wind Direction |

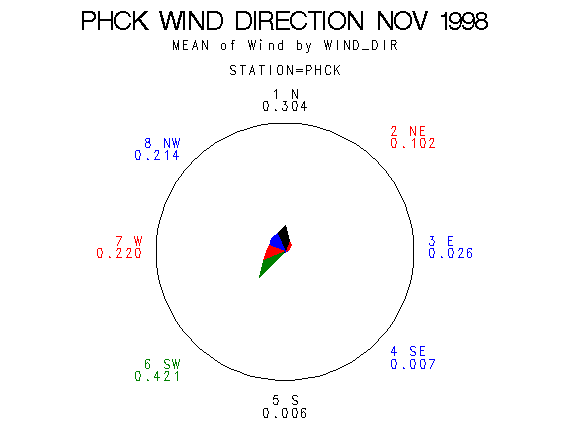 |
| Wind Vectors (circle=1.5 m/s) |

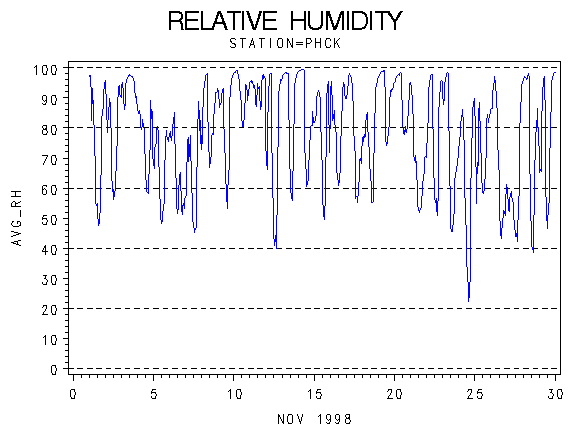 |
| Relative Humidity (percent) |

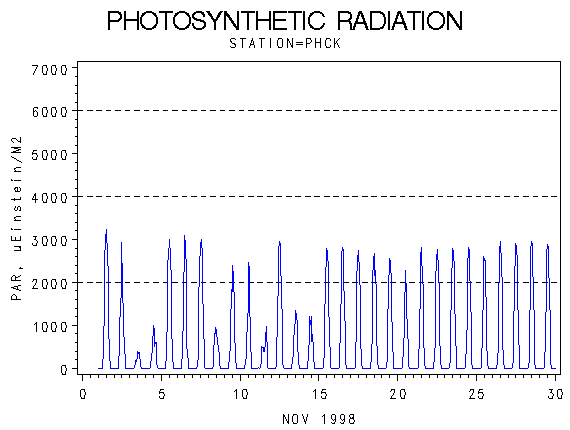 |
| Photosynthetically Active Radiation (micro-einsteins per m squared) |

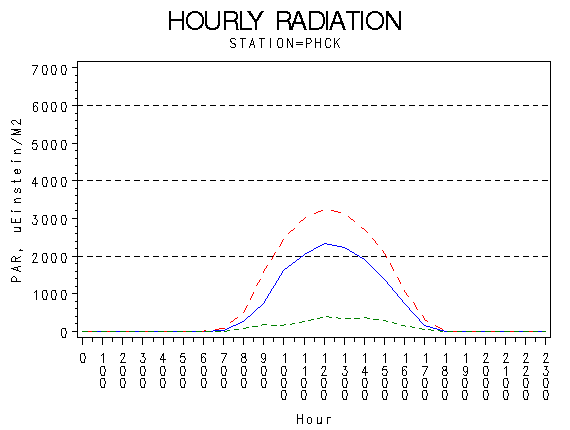 |
| Hourly Photosynthetically Active Radiation (micro-einsteins per m squared) |

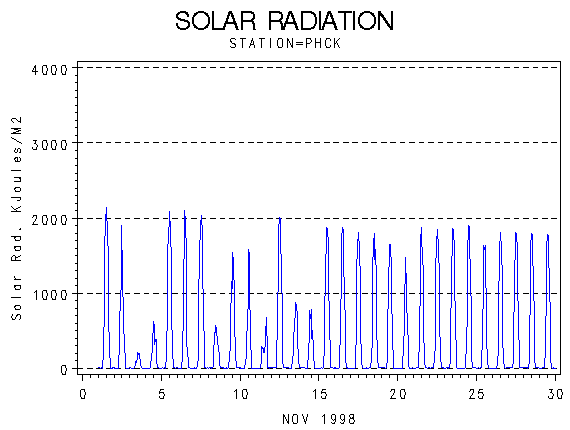 |
| Solar Radiation (KiloJoules per Meter Squared) |

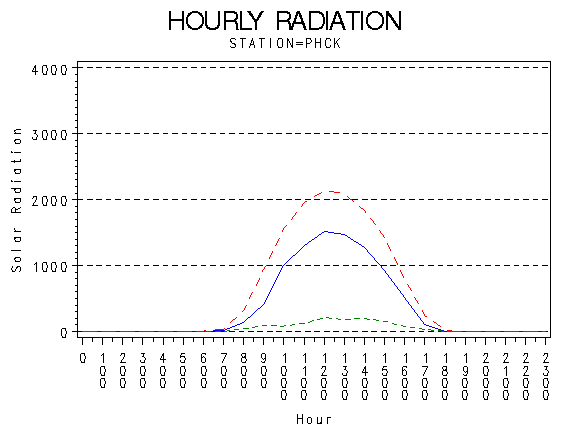 |
| Hourly Solar Radiation (KiloJoules per Meter Squared) |

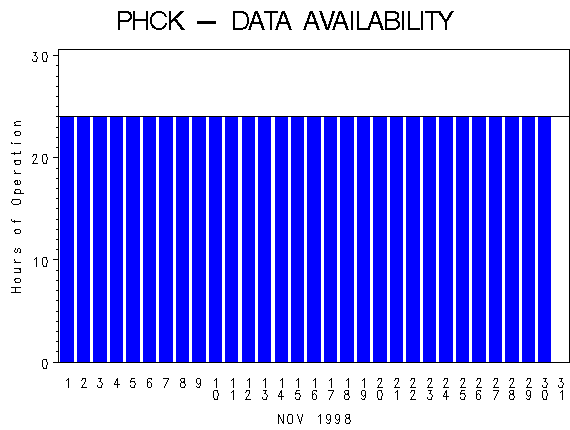 |
| Hours of Station Operation |

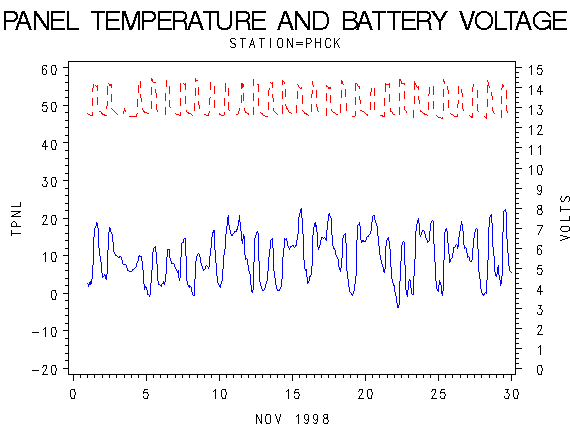 |
| Data Logger Battery Voltage and Internal Logger Temperature |
