
|
| VIRGINIA COAST RESERVE LONG-TERM ECOLOGICAL RESEARCH |
Site PHCK, Month SEP, Year 1997 |

| 
|
| Day of Month | Precip (mm) | Max Temp. oC | Min Temp. oC | Mean Temp. oC | Wind Speed (m/s) | Wind Dir (deg.) | Vapor Press. (mb) | Solar Rad. KJ/m2 | PAR uE/m2 |
|---|---|---|---|---|---|---|---|---|---|
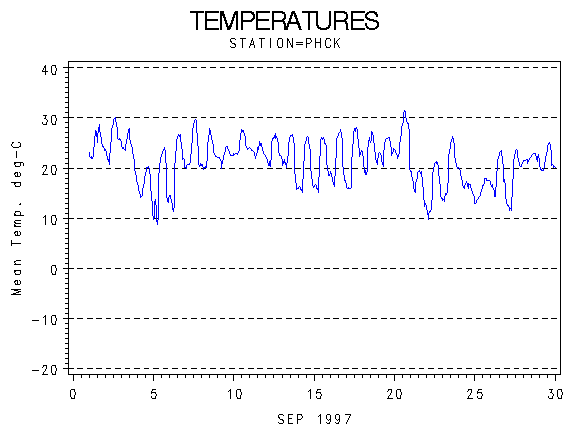
| 1 | 0.00 | 29 | 22 | 24.8 | 0.43 | 173 | 26.71 | 12268 | 22511 |
| 2 | 0.00 | 31 | 20 | 25.7 | 1.04 | 172 | 27.22 | 20725 | 36199 |
| 3 | 0.00 | 29 | 17 | 23.6 | 2.69 | 333 | 21.98 | 14841 | 27351 |
| 4 | 0.00 | 21 | 10 | 16.6 | 3.05 | 357 | 10.02 | 23027 | 41759 |
| 5 | 0.00 | 25 | 8 | 16.9 | 1.10 | 260 | 12.12 | 22370 | 40466 |
| 6 | 0.00 | 28 | 11 | 20.3 | 1.31 | 187 | 16.96 | 19705 | 35512 |
| 7 | 0.00 | 30 | 20 | 23.7 | 1.46 | 215 | 18.40 | 21404 | 37947 |
| 8 | 0.00 | 28 | 19 | 23.1 | 1.14 | 76 | 24.01 | 17003 | 30803 |
| 9 | 0.00 | 25 | 19 | 22.5 | 2.49 | 68 | 24.73 | 11795 | 20321 |
| 10 | 0.00 | 28 | 23 | 24.7 | 0.47 | 152 | 26.54 | 19148 | 34390 |
| 11 | 0.00 | 26 | 22 | 23.5 | 1.49 | 173 | 25.47 | 9084 | 16384 |
| 12 | 0.00 | 27 | 20 | 23.5 | 0.35 | 187 | 25.27 | 14835 | 25961 |
| 13 | 0.00 | 27 | 15 | 22.1 | 0.90 | 313 | 19.65 | 19171 | 32495 |
| 14 | 0.00 | 27 | 15 | 20.2 | 0.80 | 265 | 18.00 | 18045 | 31410 |
| 15 | 0.00 | 27 | 15 | 20.8 | 0.49 | 190 | 19.07 | 12102 | 20816 |
| 16 | 0.00 | 28 | 16 | 21.6 | 0.37 | 61 | 19.76 | 18799 | 31943 |
| 17 | 0.00 | 29 | 15 | 22.1 | 0.55 | 177 | 20.67 | 18906 | 32322 |
| 18 | 0.00 | 28 | 18 | 22.9 | 0.69 | 210 | 23.87 | 9780 | 17055 |
| 19 | 0.00 | 27 | 20 | 23.8 | 0.51 | 101 | 25.54 | 17524 | 30181 |
| 20 | 0.00 | 32 | 19 | 26.3 | 2.99 | 197 | 25.04 | 17518 | 30514 |
| 21 | 0.00 | 20 | 11 | 17.0 | 2.90 | 14 | 11.48 | 19881 | 36970 |
| 22 | 0.00 | 22 | 9 | 16.0 | 0.92 | 47 | 12.62 | 19542 | 36026 |
| 23 | 0.00 | 27 | 13 | 20.0 | 1.61 | 216 | 17.27 | 15918 | 29649 |
| 24 | 0.00 | 20 | 13 | 16.7 | 2.23 | 35 | 12.94 | 5127 | 10207 |
| 25 | 0.00 | 19 | 13 | 15.8 | 1.00 | 18 | 17.14 | 4085 | 7977 |
| 26 | 0.00 | 24 | 13 | 18.4 | 1.54 | 300 | 15.95 | 18369 | 32261 |
| 27 | 0.00 | 24 | 11 | 18.2 | 1.68 | 69 | 16.33 | 16160 | 28632 |
| 28 | 0.00 | 23 | 21 | 22.0 | 2.06 | 79 | 24.38 | 2861 | 5959 |
| 29 | 0.00 | 25 | 19 | 21.6 | 4.07 | 209 | 17.28 | 17600 | 31096 |
| 30 | 0.00 | 28 | 15 | 21.9 | 3.90 | 206 | 14.74 | 17423 | 32513 |
| Mon. Tot. Precip. 0.0 mm | Mean wind vel. 1.542 m/s |
| Mon. Mean Temp. 21.2 deg. C | Wind dir 172 deg |
| Mean Max. Temp. 26.1 deg. C | Mean Min. Temp. 16.0 deg. C |
| Extreme Max. Temp 32.2 deg. C | Mean vapor press 19.71 mb |
| Extreme Min. Temp 8.2 deg. C | Total Solar Rad 475016 KJ/sq. m |
| Total photosyn. 847630 uEin/sq.m |
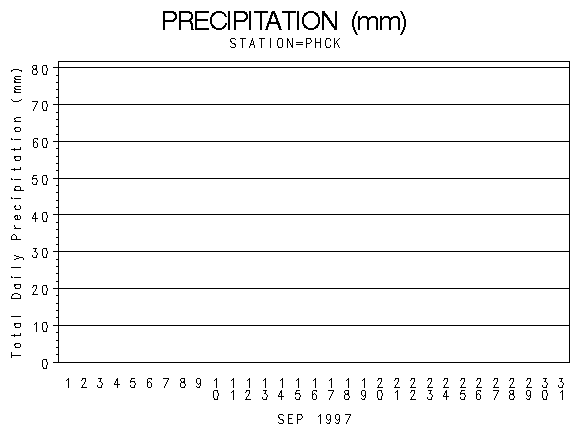 |
| Daily Total Precipitation (mm) |

 |
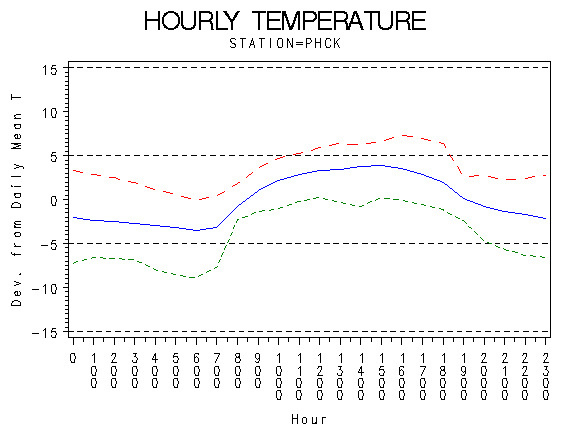
| Hourly Mean Temperatures (deg. C) |
 |
| Hourly Max Min and Mean Temperatures (deg. C) |
 |
| Wind Speed (m/s) |
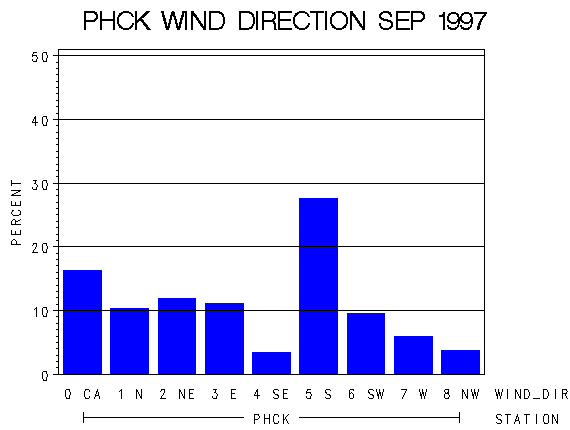 |
| Frequency of Wind Direction |
 |
| Wind Vectors (circle=1.5 m/s) |
 |
| Relative Humidity (percent) |
 |
| Photosynthetically Active Radiation (micro-einsteins per m squared) |
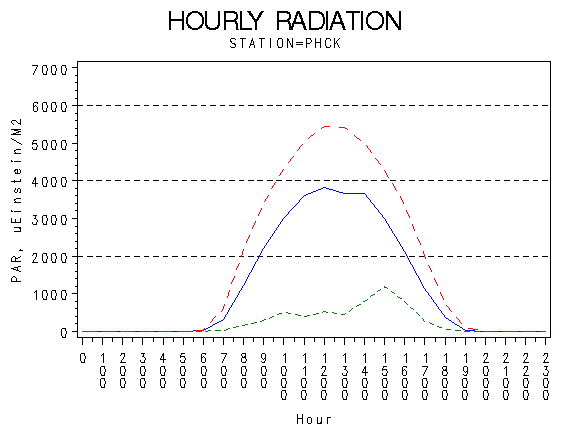 |
| Hourly Photosynthetically Active Radiation (micro-einsteins per m squared) |
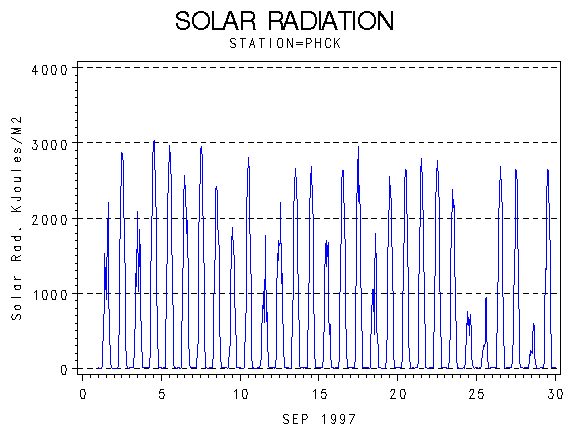 |
| Solar Radiation (KiloJoules per Meter Squared) |
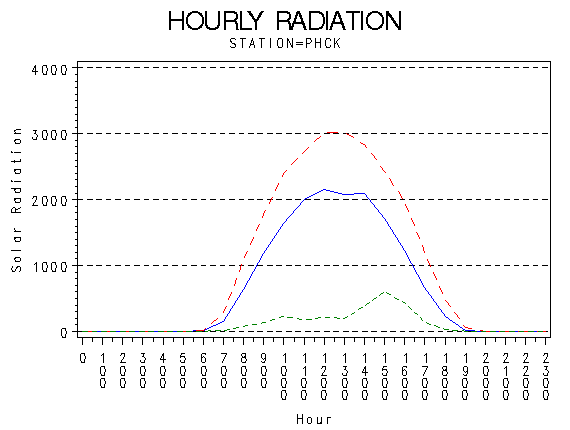 |
| Hourly Solar Radiation (KiloJoules per Meter Squared) |
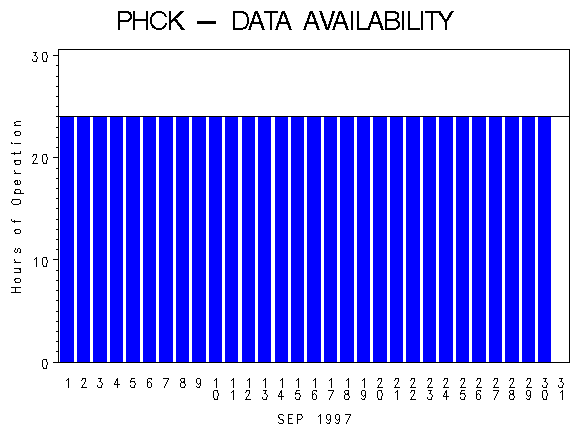 |
| Hours of Station Operation |
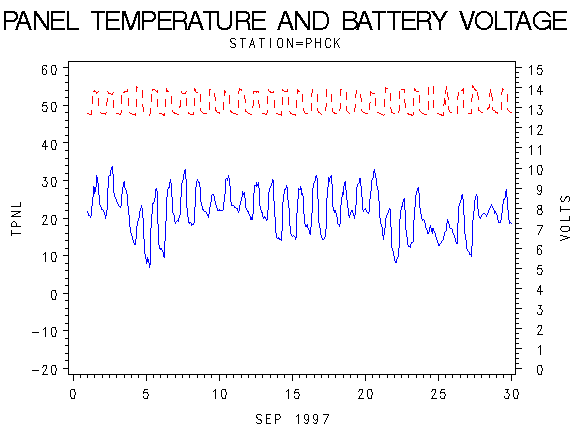 |
| Data Logger Battery Voltage and Internal Logger Temperature |