

| VIRGINIA COAST RESERVE LONG-TERM ECOLOGICAL RESEARCH |
Site PHCK, Month MAY, Year 1997 |

| 
|
| Day of Month | Precip (mm) | Max Temp. oC | Min Temp. oC | Mean Temp. oC | Wind Speed (m/s) | Wind Dir (deg.) | Vapor Press. (mb) | Solar Rad. KJ/m2 | PAR uE/m2 |
|---|---|---|---|---|---|---|---|---|---|
| 1 | 0.00 | 27 | 12 | 19.0 | 3.51 | 176 | 17.05 | 19826 | 39167 |
| 2 | 0.00 | 20 | 12 | 14.8 | 2.38 | 287 | 9.58 | 25478 | 48715 |
| 3 | 0.00 | 23 | 12 | 17.6 | 2.90 | 175 | 17.31 | 11097 | 22083 |
| 4 | 0.00 | 19 | 9 | 15.8 | 3.48 | 261 | 10.03 | 24993 | 47822 |
| 5 | 0.00 | 20 | 8 | 14.4 | 1.38 | 171 | 9.92 | 25788 | 47673 |
| 6 | 0.00 | 24 | 9 | 17.0 | 4.05 | 184 | 11.69 | 21161 | 39525 |
| 7 | 0.00 | 19 | 8 | 14.2 | 1.73 | 269 | 8.55 | 26556 | 49279 |
| 8 | 0.00 | 18 | 9 | 13.7 | 0.85 | 87 | 9.70 | 24271 | 46003 |
| 9 | 0.00 | 25 | 13 | 18.7 | 2.82 | 205 | 15.96 | 19239 | 37012 |
| 10 | 0.00 | 17 | 10 | 12.8 | 3.32 | 256 | 9.75 | 15259 | 29457 |
| 11 | 0.00 | 20 | 10 | 14.3 | 3.17 | 234 | 8.96 | 26699 | 49678 |
| 12 | 0.00 | 25 | 13 | 18.6 | 4.05 | 174 | 13.35 | 24043 | 45525 |
| 13 | 0.00 | 20 | 8 | 16.6 | 2.22 | 254 | 15.46 | 11448 | 22263 |
| 14 | 0.00 | 21 | 6 | 14.9 | 1.41 | 177 | 12.59 | 25699 | 47191 |
| 15 | 0.00 | 26 | 13 | 19.9 | 2.91 | 183 | 15.41 | 18350 | 35149 |
| 16 | 0.00 | 19 | 10 | 14.5 | 3.70 | 233 | 9.30 | 26649 | 48434 |
| 17 | 0.00 | 25 | 7 | 16.9 | 2.71 | 185 | 10.41 | 24343 | 46246 |
| 18 | 0.00 | 28 | 10 | 19.4 | 1.50 | 165 | 15.48 | 25651 | 48177 |
| 19 | 0.00 | 32 | 21 | 25.9 | 4.65 | 181 | 16.96 | 25500 | 47924 |
| 20 | 0.00 | 27 | 12 | 21.9 | 2.94 | 238 | 18.47 | 14707 | 28962 |
| 21 | 0.00 | 21 | 13 | 17.0 | 2.81 | 331 | 8.67 | 24059 | 44990 |
| 22 | 0.00 | 20 | 9 | 15.0 | 2.89 | 283 | 7.84 | 27825 | 52084 |
| 23 | 0.00 | 22 | 8 | 15.1 | 1.28 | 261 | 9.66 | 27106 | 50481 |
| 24 | 0.00 | 24 | 9 | 18.2 | 1.06 | 165 | 16.52 | 25632 | 47355 |
| 25 | 0.00 | 26 | 20 | 22.5 | 5.35 | 174 | 21.22 | 14989 | 30026 |
| 26 | 0.00 | 22 | 12 | 16.7 | 3.74 | 98 | 17.60 | 4427 | 9619 |
| 27 | 0.00 | 17 | 10 | 13.3 | 2.86 | 65 | 12.00 | 19638 | 36840 |
| 28 | 0.00 | 17 | 7 | 13.7 | 2.24 | 68 | 10.05 | 28120 | 52036 |
| 29 | 0.00 | 19 | 6 | 14.6 | 1.28 | 78 | 13.20 | 26839 | 50607 |
| 30 | 0.00 | 22 | 13 | 17.6 | 1.08 | 72 | 18.36 | 21625 | 41263 |
| 31 | 0.00 | 22 | 17 | 18.9 | 1.01 | 37 | 20.21 | 14287 | 26985 |
| Mon. Tot. Precip. 0.0 mm | Mean wind vel. 2.621 m/s |
| Mon. Mean Temp. 16.9 deg. C | Wind dir 196 deg |
| Mean Max. Temp. 22.1 deg. C | Mean Min. Temp. 10.9 deg. C |
| Extreme Max. Temp 31.7 deg. C | Mean vapor press 13.27 mb |
| Extreme Min. Temp 6.2 deg. C | Total Solar Rad 671304 KJ/sq. m |
| Total photosyn. 1268572 uEin/sq.m |
 |
| Daily Total Precipitation (mm) |

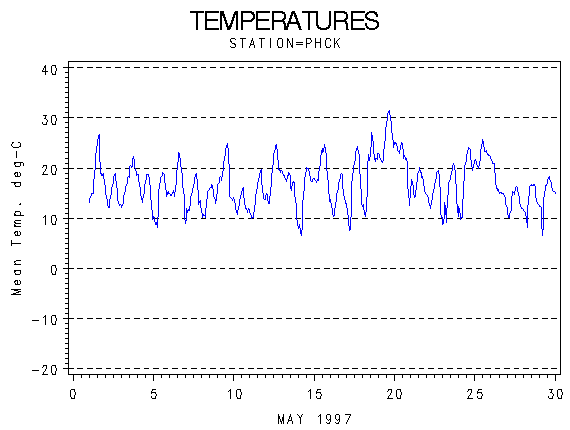 |
| Hourly Mean Temperatures (deg. C) |

 |
| Hourly Max Min and Mean Temperatures (deg. C) |

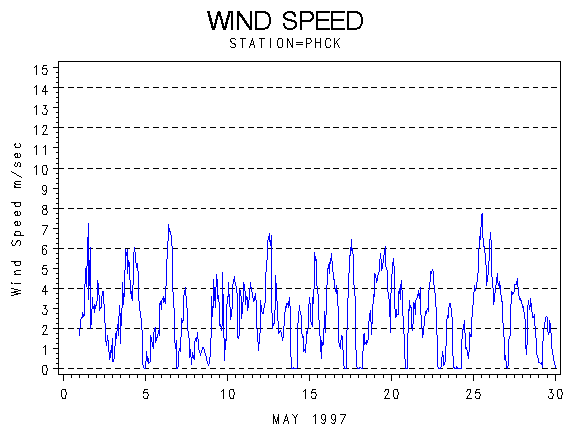 |
| Wind Speed (m/s) |

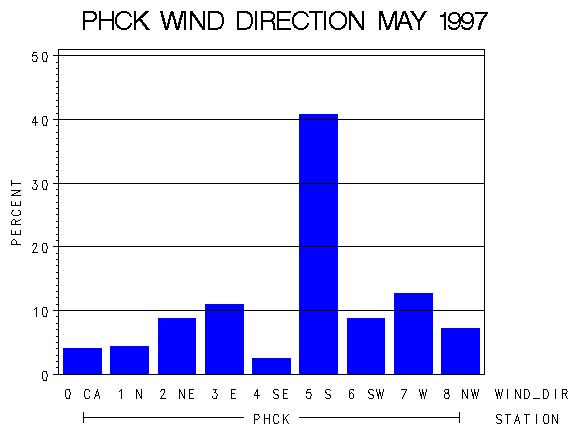 |
| Frequency of Wind Direction |

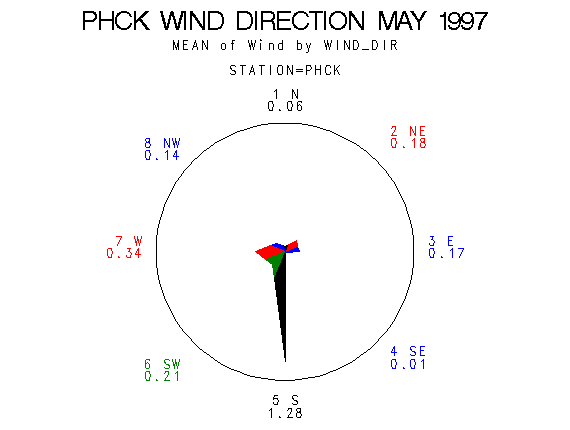 |
| Wind Vectors (circle=1.5 m/s) |

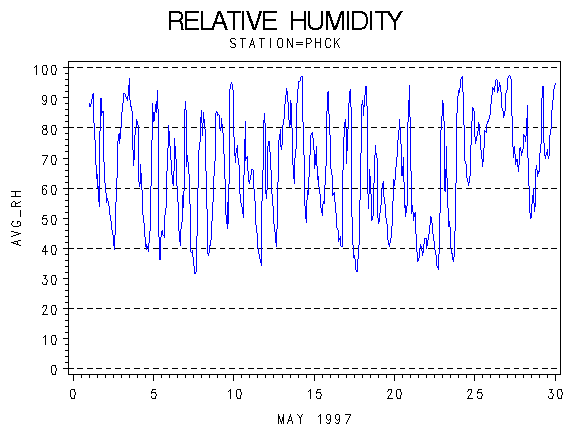 |
| Relative Humidity (percent) |

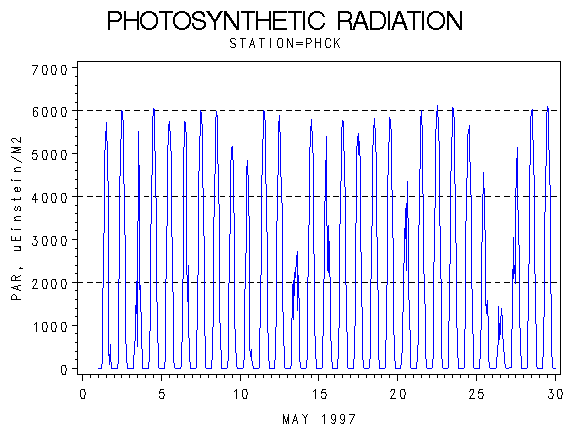 |
| Photosynthetically Active Radiation (micro-einsteins per m squared) |

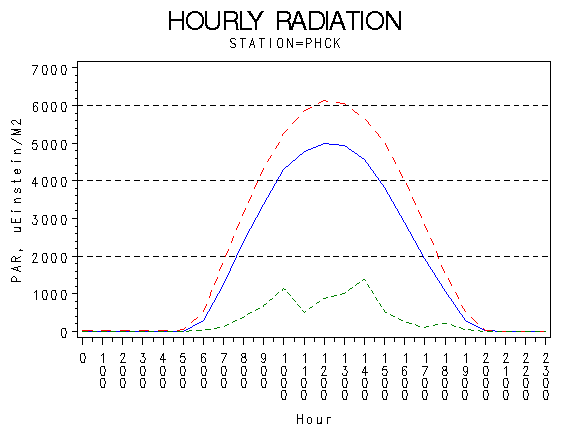 |
| Hourly Photosynthetically Active Radiation (micro-einsteins per m squared) |

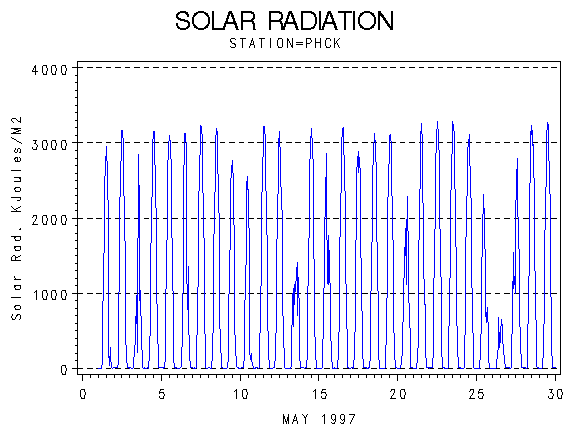 |
| Solar Radiation (KiloJoules per Meter Squared) |

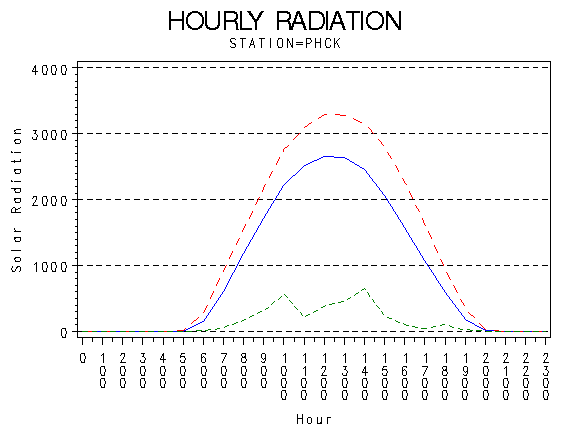 |
| Hourly Solar Radiation (KiloJoules per Meter Squared) |

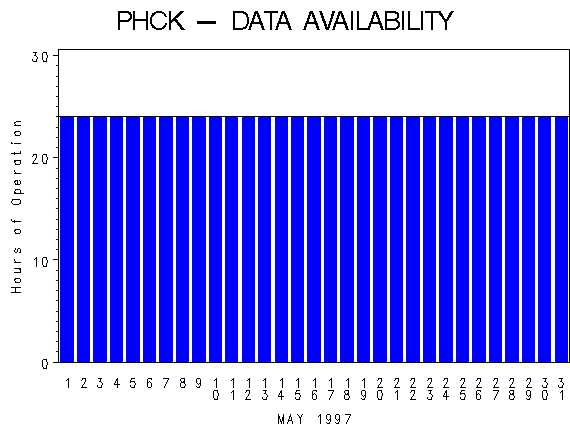 |
| Hours of Station Operation |

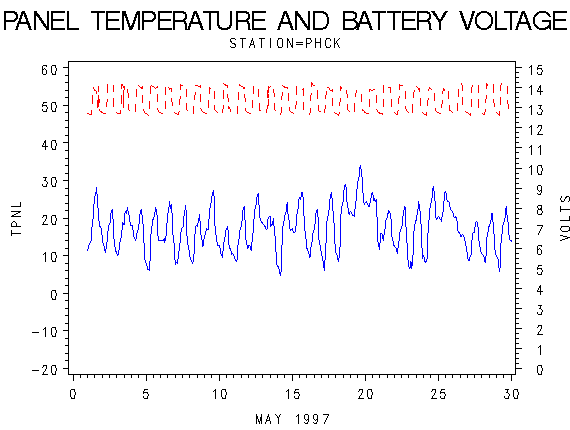 |
| Data Logger Battery Voltage and Internal Logger Temperature |
