
|
| VIRGINIA COAST RESERVE LONG-TERM ECOLOGICAL RESEARCH |
Site PHCK, Month SEP, Year 1996 |

| 
|
| Day of Month | Precip (mm) | Max Temp. oC | Min Temp. oC | Mean Temp. oC | Wind Speed (m/s) | Wind Dir (deg.) | Vapor Press. (mb) | Solar Rad. KJ/m2 | PAR uE/m2 |
|---|---|---|---|---|---|---|---|---|---|
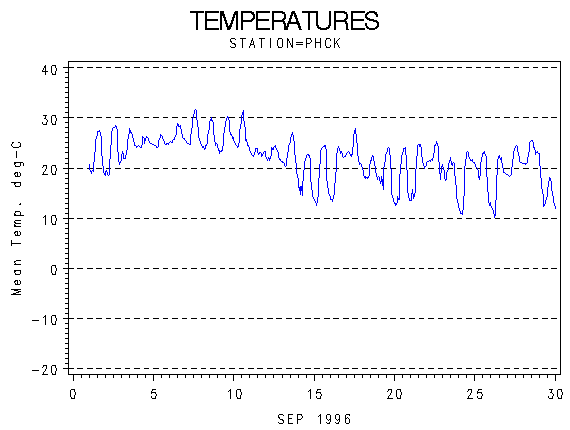
| 1 | 0.00 | 28 | 19 | 22.7 | 2.02 | 353 | 20.73 | 22115 | 45476 |
| 2 | 0.00 | 29 | 18 | 23.4 | 1.17 | 294 | 21.80 | 20784 | 39963 |
| 3 | 0.00 | 29 | 21 | 24.4 | 0.25 | 229 | 26.06 | 8550 | 16667 |
| 4 | 0.76 | 27 | 24 | 25.1 | 0.53 | 87 | 27.61 | 7731 | 14943 |
| 5 | 0.51 | 27 | 24 | 25.1 | 2.13 | 72 | 28.63 | 10692 | 19971 |
| 6 | 0.76 | 29 | 25 | 26.6 | 2.16 | 107 | 29.80 | 15725 | 28521 |
| 7 | 0.00 | 32 | 24 | 27.3 | 2.46 | 221 | 29.13 | 21129 | 42004 |
| 8 | 0.00 | 31 | 23 | 26.2 | 1.36 | 223 | 28.19 | 15040 | 30791 |
| 9 | 0.00 | 31 | 22 | 26.4 | 1.08 | 240 | 29.22 | 19357 | 38500 |
| 10 | 0.25 | 32 | 24 | 26.5 | 1.66 | 259 | 28.52 | 14508 | 29549 |
| 11 | 27.94 | 24 | 22 | 23.0 | 0.73 | 237 | 26.40 | 4304 | 8705 |
| 12 | 12.95 | 25 | 21 | 22.7 | 1.10 | 307 | 24.97 | 7602 | 14219 |
| 13 | 0.00 | 28 | 17 | 22.8 | 1.54 | 271 | 22.40 | 16042 | 27441 |
| 14 | 0.00 | 23 | 13 | 18.5 | 1.33 | 314 | 14.85 | 20185 | 39938 |
| 15 | 0.00 | 25 | 12 | 18.7 | 1.19 | 259 | 14.07 | 20819 | 40280 |
| 16 | 7.87 | 25 | 13 | 19.7 | 0.56 | 221 | 19.68 | 5584 | 11236 |
| 17 | 7.87 | 29 | 20 | 23.4 | 3.52 | 268 | 23.89 | 11207 | 20676 |
| 18 | 0.00 | 23 | 17 | 19.5 | 3.53 | 316 | 15.53 | 11916 | 22751 |
| 19 | 0.00 | 25 | 13 | 19.2 | 1.58 | 327 | 15.67 | 19782 | 40066 |
| 20 | 0.00 | 24 | 12 | 17.7 | 1.02 | 324 | 15.10 | 20367 | 38371 |
| 21 | 0.00 | 25 | 13 | 19.6 | 0.77 | 240 | 17.57 | 14323 | 26116 |
| 22 | 0.51 | 26 | 17 | 21.9 | 1.70 | 282 | 20.63 | 14459 | 26613 |
| 23 | 0.00 | 23 | 12 | 18.9 | 2.61 | 312 | 14.76 | 11356 | 23539 |
| 24 | 0.00 | 24 | 10 | 18.1 | 1.60 | 223 | 16.69 | 14665 | 27622 |
| 25 | 0.00 | 24 | 12 | 19.5 | 1.55 | 350 | 15.39 | 19093 | 37537 |
| 26 | 0.00 | 23 | 10 | 17.4 | 0.34 | 120 | 14.37 | 15088 | 28487 |
| 27 | 0.00 | 25 | 18 | 21.3 | 0.52 | 149 | 20.35 | 17293 | 33726 |
| 28 | 0.00 | 26 | 21 | 23.0 | 1.26 | 222 | 24.38 | 12812 | 26623 |
| 29 | 35.56 | 23 | 12 | 15.8 | 1.55 | 11 | 16.67 | 4669 | 9349 |
| 30 | 0.00 | 23 | 10 | 16.5 | 0.56 | 69 | 14.67 | 17221 | 30868 |
| Mon. Tot. Precip. 95.0 mm | Mean wind vel. 1.446 m/s |
| Mon. Mean Temp. 21.7 deg. C | Wind dir 288 deg |
| Mean Max. Temp. 26.3 deg. C | Mean Min. Temp. 17.4 deg. C |
| Extreme Max. Temp 32.0 deg. C | Mean vapor press 21.26 mb |
| Extreme Min. Temp 9.8 deg. C | Total Solar Rad 434417 KJ/sq. m |
| Total photosyn. 840550 uEin/sq.m |
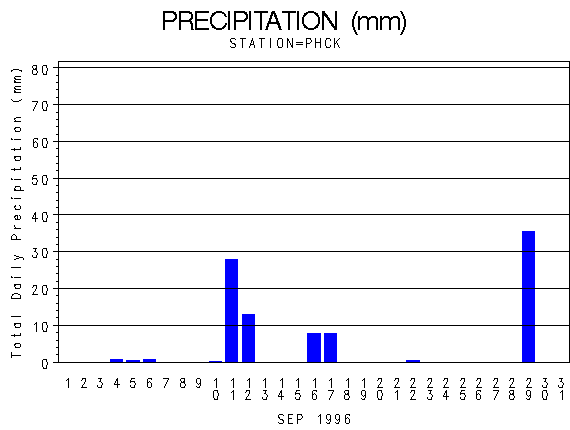 |
| Daily Total Precipitation (mm) |

 |
| Hourly Mean Temperatures (deg. C) |
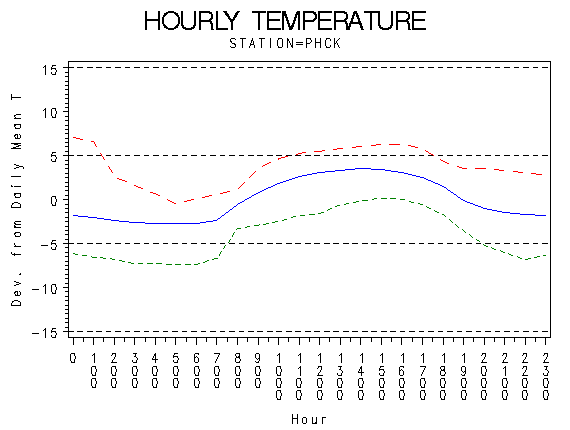 |
| Hourly Max Min and Mean Temperatures (deg. C) |
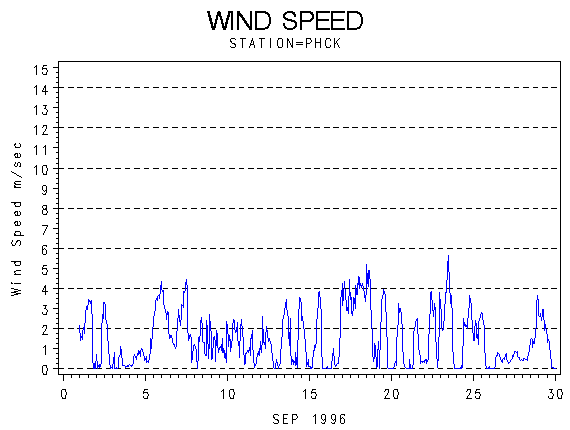 |
| Wind Speed (m/s) |
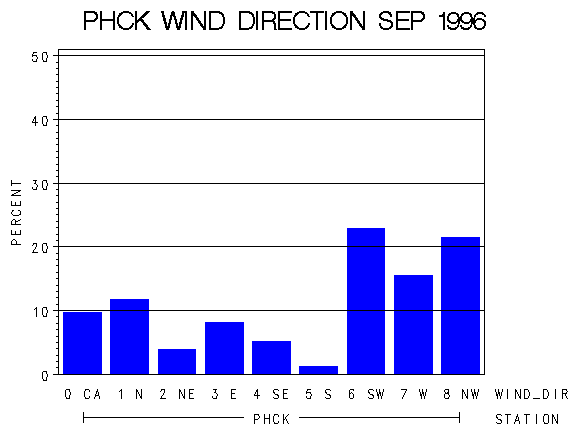 |
| Frequency of Wind Direction |
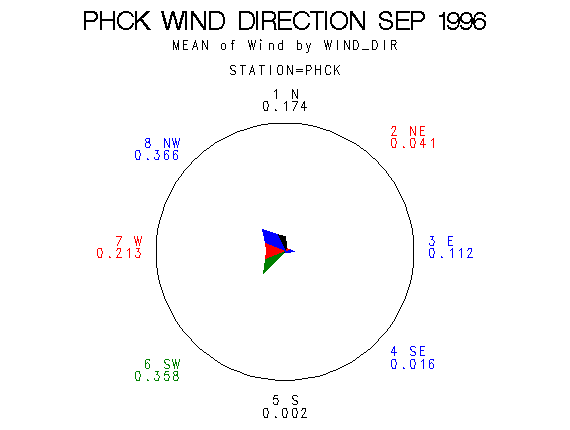 |
| Wind Vectors (circle=1.5 m/s) |
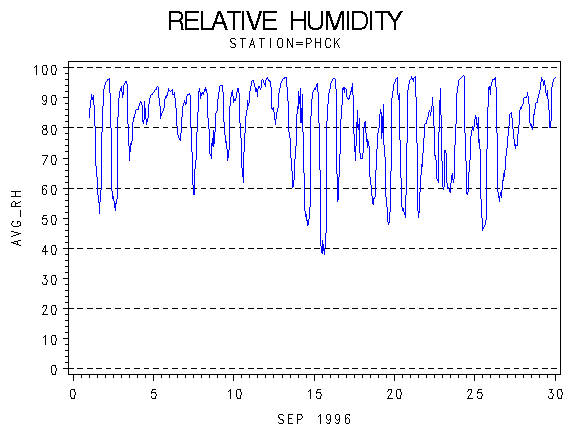 |
| Relative Humidity (percent) |
 |
| Photosynthetically Active Radiation (micro-einsteins per m squared) |
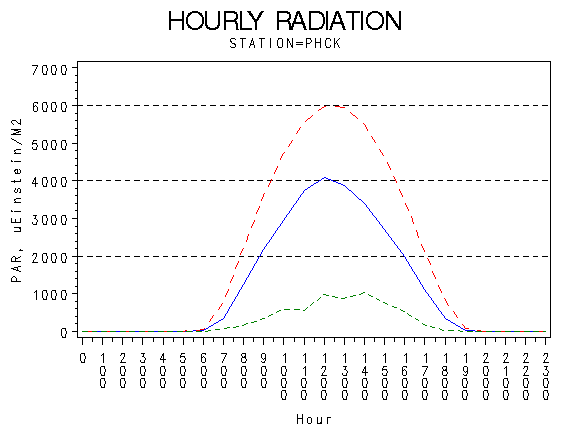 |
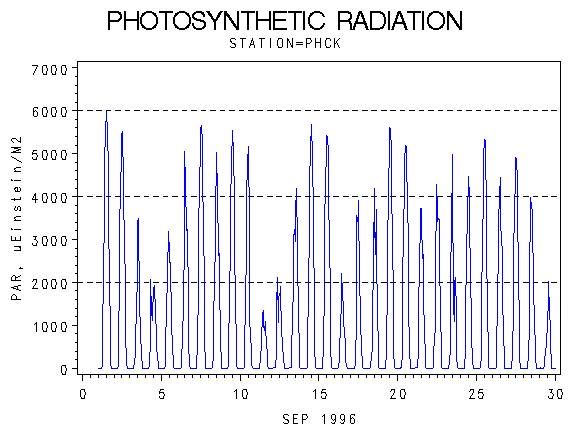
| Hourly Photosynthetically Active Radiation (micro-einsteins per m squared) |
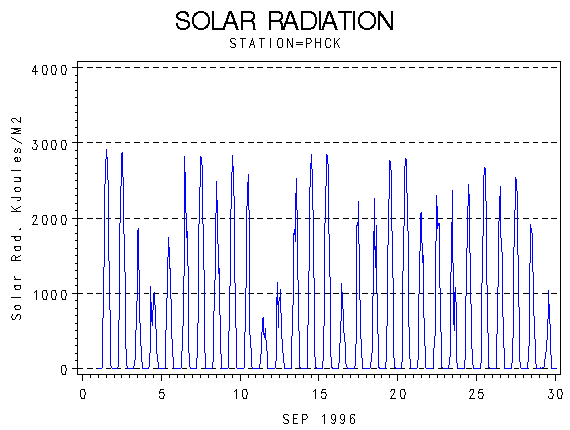 |
| Solar Radiation (KiloJoules per Meter Squared) |
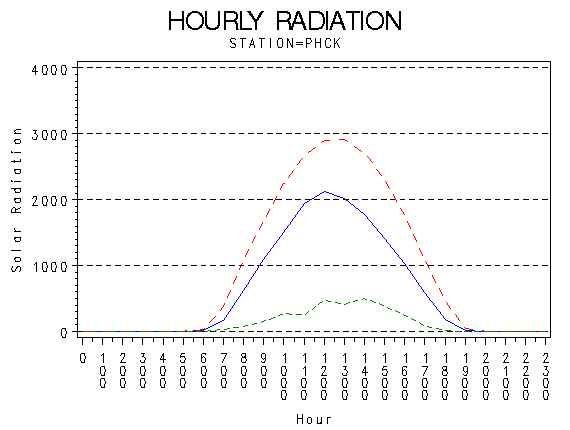 |
| Hourly Solar Radiation (KiloJoules per Meter Squared) |
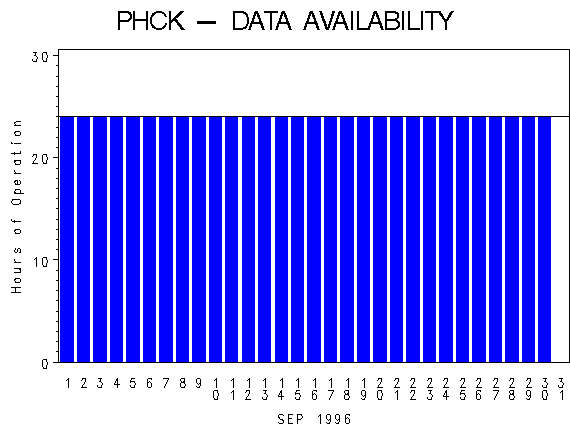 |
| Hours of Station Operation |
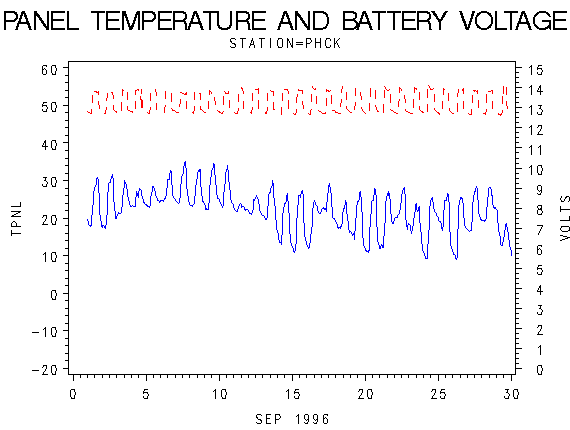 |
| Data Logger Battery Voltage and Internal Logger Temperature |