

| VIRGINIA COAST RESERVE LONG-TERM ECOLOGICAL RESEARCH |
Site PHCK, Month MAY, Year 1994 |

| 
|
| Day of Month | Precip (mm) | Max Temp. oC | Min Temp. oC | Mean Temp. oC | Wind Speed (m/s) | Wind Dir (deg.) | Vapor Press. (mb) | Solar Rad. KJ/m2 | PAR uE/m2 |
|---|---|---|---|---|---|---|---|---|---|
| 1 | 2.60 | 25 | 15 | 21.0 | 4.10 | 242 | 21.05 | 12256 | 22432 |
| 2 | 1.00 | 16 | 6 | 11.9 | 3.00 | 360 | 9.02 | 27586 | 47505 |
| 3 | 0.00 | 17 | 3 | 11.6 | 2.31 | 66 | 11.42 | 26041 | 46377 |
| 4 | 10.80 | 14 | 11 | 12.5 | 4.84 | 53 | 14.04 | 3293 | 7200 |
| 5 | 0.00 | 18 | 12 | 13.8 | 2.75 | 324 | 15.00 | 13121 | 24443 |
| 6 | 0.00 | 23 | 11 | 15.6 | 2.48 | 269 | 14.88 | 17495 | 31594 |
| 7 | 0.00 | 19 | 9 | 15.2 | 1.42 | 122 | 15.05 | 12841 | 23544 |
| 8 | 7.40 | 21 | 13 | 17.0 | 3.31 | 284 | 16.56 | 8314 | 15469 |
| 9 | 0.00 | 22 | 8 | 16.0 | 1.80 | 251 | 13.14 | 26025 | 44961 |
| 10 | 0.00 | 21 | 8 | 15.7 | 1.78 | 307 | 14.32 | 12702 | 23080 |
| 11 | 0.00 | 22 | 5 | 15.2 | 1.15 | 199 | 12.64 | 28013 | 48417 |
| 12 | 0.00 | 26 | 14 | 19.4 | 4.41 | 261 | 17.27 | 16205 | 29136 |
| 13 | 0.00 | 18 | 7 | 13.6 | 3.10 | 335 | 8.55 | 26965 | 46850 |
| 14 | 0.00 | 18 | 7 | 13.8 | 0.99 | 79 | 11.41 | 27511 | 48494 |
| 15 | 0.00 | 30 | 15 | 22.7 | 3.76 | 229 | 21.06 | 23880 | 43656 |
| 16 | 8.10 | 26 | 15 | 21.1 | 3.05 | 291 | 19.38 | 25071 | 44817 |
| 17 | 0.00 | 17 | 12 | 14.3 | 4.25 | 341 | 11.47 | 16928 | 29695 |
| 18 | 0.00 | 19 | 11 | 14.4 | 3.00 | 343 | 12.48 | 20759 | 37027 |
| 19 | 0.00 | 14 | 10 | 11.6 | 2.73 | 43 | 12.55 | 6295 | 12196 |
| 20 | 0.00 | 14 | 8 | 10.3 | 2.83 | 40 | 11.14 | 8580 | 16162 |
| 21 | 0.00 | 16 | 7 | 11.5 | 1.97 | 50 | 12.05 | 21991 | 38550 |
| 22 | 0.00 | 22 | 7 | 14.5 | 1.61 | 52 | 12.64 | 24358 | 43213 |
| 23 | 0.00 | 30 | 9 | 20.0 | 1.50 | 321 | 17.38 | 27742 | 49206 |
| 24 | 0.00 | 27 | 17 | 22.2 | 1.61 | 270 | 19.00 | 27836 | 49225 |
| 25 | 3.80 | 29 | 19 | 22.8 | 2.14 | 229 | 22.95 | 21744 | 38468 |
| 26 | 36.50 | 28 | 18 | 21.7 | 3.47 | 231 | 23.02 | 17557 | 32221 |
| 27 | 0.50 | 19 | 8 | 15.6 | 3.43 | 329 | 14.13 | 27899 | 48795 |
| 28 | 0.00 | 21 | 6 | 14.5 | 1.09 | 256 | 11.07 | 29518 | 50849 |
| 29 | 0.00 | 24 | 10 | 18.7 | 1.33 | 237 | 14.62 | 29256 | 51214 |
| 30 | 0.00 | 25 | 14 | 20.2 | 0.98 | 200 | 18.58 | 29382 | 51476 |
| 31 | 0.30 | 26 | 14 | 20.3 | 0.55 | 201 | 20.74 | 21899 | 40598 |
| Mon. Tot. Precip. 71.0 mm | Mean wind vel. 2.476 m/s |
| Mon. Mean Temp. 16.4 deg. C | Wind dir 317 deg |
| Mean Max. Temp. 21.5 deg. C | Mean Min. Temp. 10.6 deg. C |
| Extreme Max. Temp 29.9 deg. C | Mean vapor press 15.12 mb |
| Extreme Min. Temp 3.3 deg. C | Total Solar Rad 639060 KJ/sq. m |
| Total photosyn. 1136872 uEin/sq.m |
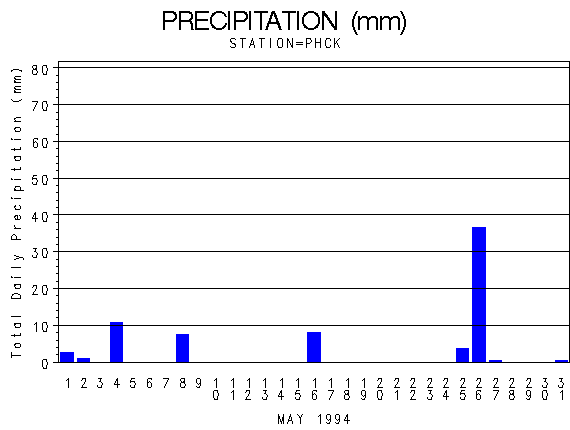 |
| Daily Total Precipitation (mm) |

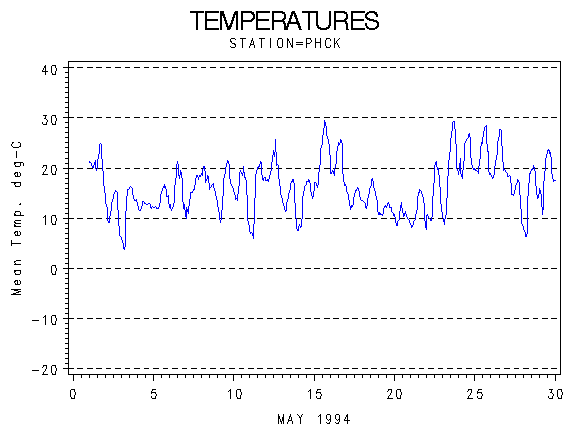 |
| Hourly Mean Temperatures (deg. C) |

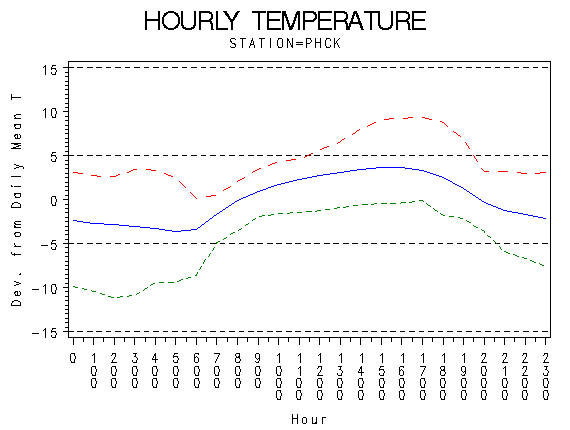 |
| Hourly Max Min and Mean Temperatures (deg. C) |

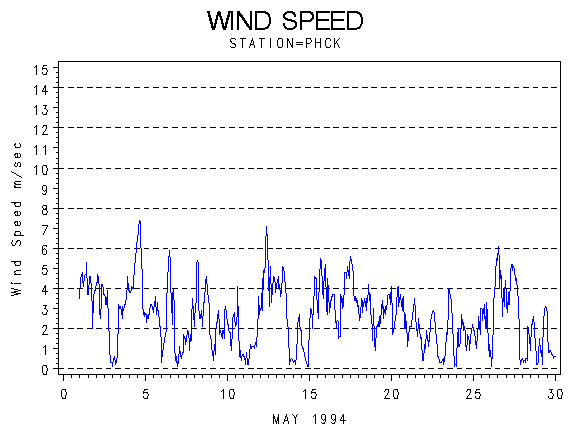 |
| Wind Speed (m/s) |

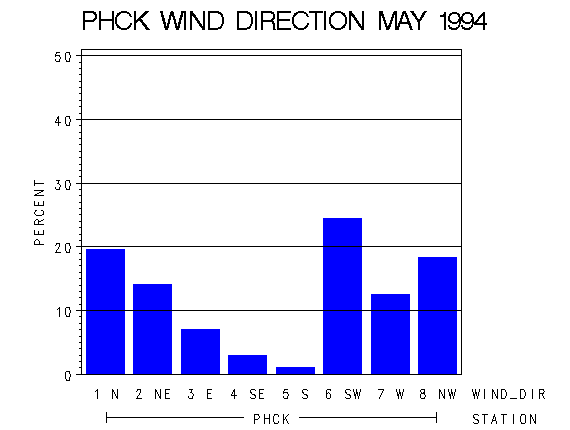 |
| Frequency of Wind Direction |

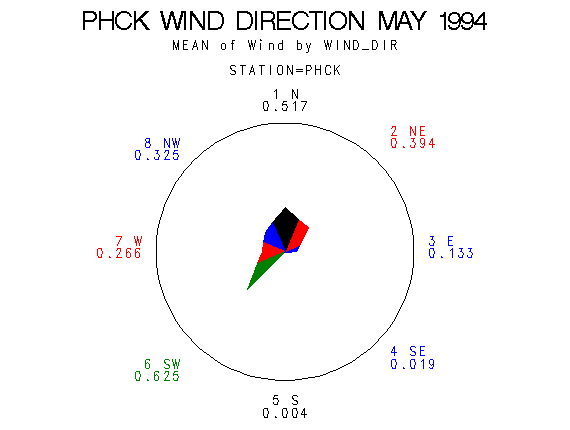 |
| Wind Vectors (circle=1.5 m/s) |

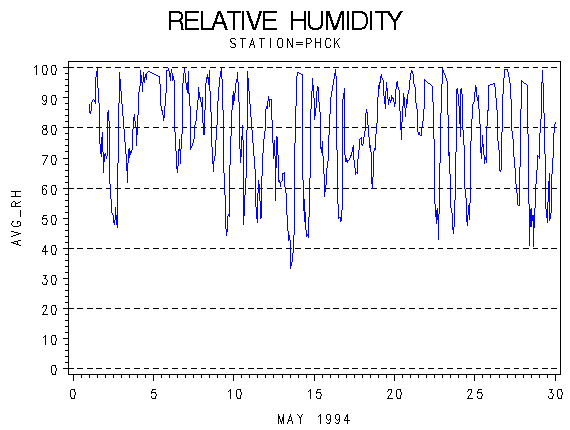 |
| Relative Humidity (percent) |

 |
| Photosynthetically Active Radiation (micro-einsteins per m squared) |

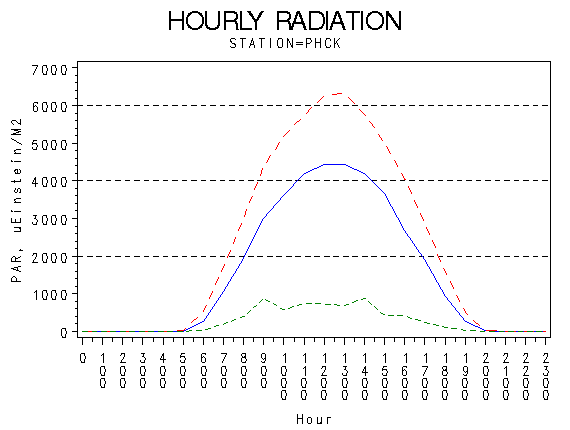 |
| Hourly Photosynthetically Active Radiation (micro-einsteins per m squared) |

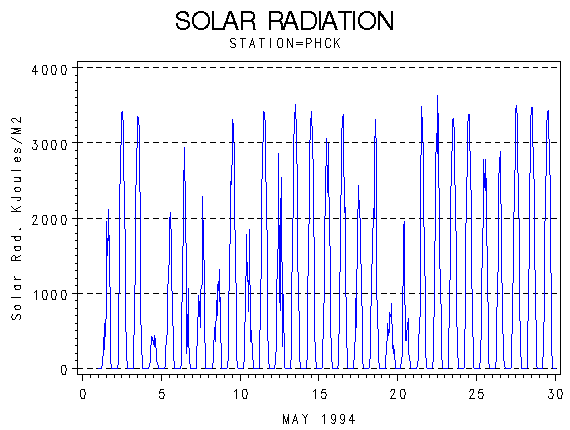 |
| Solar Radiation (KiloJoules per Meter Squared) |

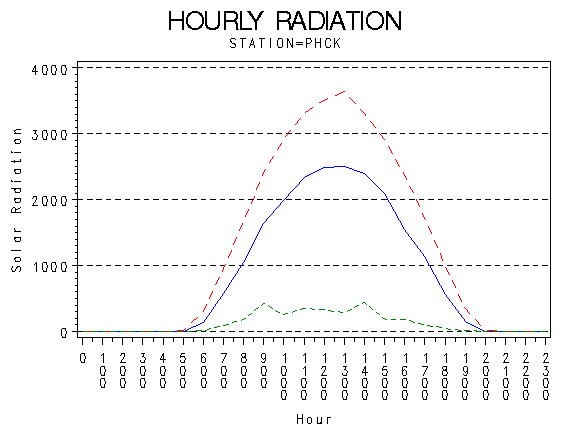 |
| Hourly Solar Radiation (KiloJoules per Meter Squared) |

 |
| Hours of Station Operation |

 |
| Data Logger Battery Voltage and Internal Logger Temperature |
