

| VIRGINIA COAST RESERVE LONG-TERM ECOLOGICAL RESEARCH |
Site PHCK, Month NOV, Year 1993 |

| 
|
| Day of Month | Precip (mm) | Max Temp. oC | Min Temp. oC | Mean Temp. oC | Wind Speed (m/s) | Wind Dir (deg.) | Vapor Press. (mb) | Solar Rad. KJ/m2 | PAR uE/m2 |
|---|---|---|---|---|---|---|---|---|---|
| 1 | 0.00 | 11 | 6 | 8.0 | 4.74 | 291 | 6.96 | 9472 | 17138 |
| 2 | 0.00 | 10 | 1 | 5.6 | 2.03 | 339 | 6.70 | 12881 | 23007 |
| 3 | 0.00 | 12 | 1 | 6.8 | 1.70 | 241 | 8.35 | 5283 | 9764 |
| 4 | 0.00 | 16 | 1 | 8.9 | 0.59 | 235 | 10.31 | 12914 | 22910 |
| 5 | 11.00 | 18 | 10 | 14.3 | 2.01 | 219 | 16.82 | 1946 | 4114 |
| 6 | 3.40 | 18 | 4 | 12.0 | 2.25 | 334 | 14.46 | 1999 | 4071 |
| 7 | 0.00 | 10 | -1 | 5.9 | 2.27 | 349 | 6.69 | 12484 | 22113 |
| 8 | 0.30 | 12 | -1 | 4.5 | 0.48 | 305 | 7.19 | 8762 | 15510 |
| 9 | 1.30 | 12 | -0 | 7.3 | 1.60 | 32 | 9.60 | 2893 | 5908 |
| 10 | 0.00 | 12 | 1 | 7.9 | 1.70 | 7 | 8.23 | 5983 | 10633 |
| 11 | 0.30 | 16 | -1 | 7.2 | 0.73 | 236 | 8.41 | 12089 | 21174 |
| 12 | 0.00 | 18 | 4 | 10.5 | 1.75 | 250 | 9.38 | 11022 | 19513 |
| 13 | 0.00 | 20 | 5 | 12.9 | 0.57 | 207 | 12.95 | 7659 | 14210 |
| 14 | 0.00 | 25 | 16 | 19.8 | 3.15 | 227 | 19.94 | 10277 | 19581 |
| 15 | 0.00 | 28 | 18 | 21.9 | 3.56 | 244 | 21.05 | 11043 | 21039 |
| 16 | 0.00 | 21 | 13 | 15.6 | 1.78 | 40 | 13.57 | 7014 | 13329 |
| 17 | 0.00 | 21 | 13 | 16.8 | 1.20 | 197 | 18.87 | 5206 | 10002 |
| 18 | 5.80 | 18 | 11 | 13.0 | 3.35 | 9 | 12.83 | 6106 | 11430 |
| 19 | 2.10 | 18 | 12 | 14.6 | 1.63 | 5 | 15.33 | 9277 | 17158 |
| 20 | 0.00 | 15 | 3 | 11.2 | 2.71 | 301 | 10.17 | 10513 | 18544 |
| 21 | 0.00 | 10 | -2 | 4.3 | 0.77 | 59 | 5.37 | 11133 | 19777 |
| 22 | 0.00 | 17 | 2 | 8.6 | 0.64 | 332 | 10.00 | 10054 | 18457 |
| 23 | 0.00 | 16 | 2 | 8.7 | 1.11 | 50 | 10.37 | 10786 | 19369 |
| 24 | 0.30 | 16 | 2 | 8.3 | 0.95 | 338 | 10.49 | 10826 | 19431 |
| 25 | 0.00 | 12 | 7 | 9.6 | 3.78 | 52 | 10.82 | 1624 | 3247 |
| 26 | 0.00 | 12 | 5 | 8.9 | 2.75 | 49 | 9.75 | 9649 | 17675 |
| 27 | 0.00 | 17 | 12 | 15.2 | 1.76 | 86 | 16.59 | 3697 | 7280 |
| 28 | 13.10 | 19 | 10 | 15.8 | 2.85 | 247 | 14.98 | 7167 | 13231 |
| 29 | 0.00 | 10 | -1 | 4.9 | 1.13 | 359 | 6.27 | 10260 | 18177 |
| 30 | 0.00 | 8 | -2 | 3.0 | 1.90 | 10 | 5.44 | 10136 | 17985 |
| Mon. Tot. Precip. 37.6 mm | Mean wind vel. 1.915 m/s |
| Mon. Mean Temp. 10.4 deg. C | Wind dir 321 deg |
| Mean Max. Temp. 15.6 deg. C | Mean Min. Temp. 5.1 deg. C |
| Extreme Max. Temp 27.9 deg. C | Mean vapor press 11.26 mb |
| Extreme Min. Temp -2.4 deg. C | Total Solar Rad 250155 KJ/sq. m |
| Total photosyn. 455777 uEin/sq.m |
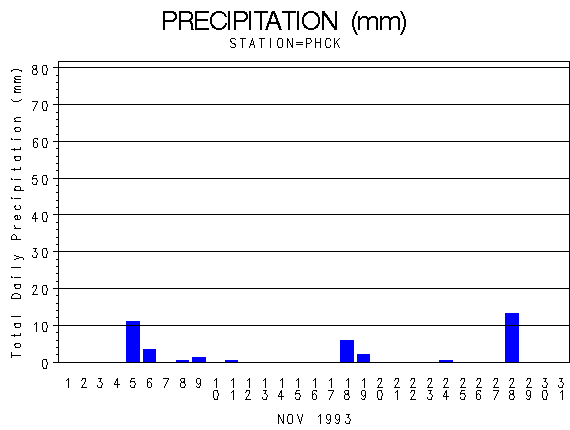 |
| Daily Total Precipitation (mm) |

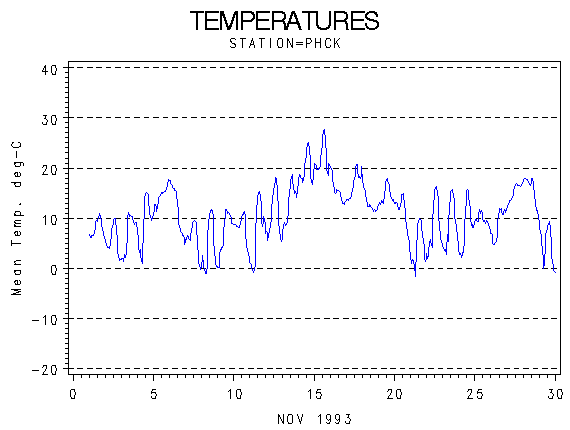 |
| Hourly Mean Temperatures (deg. C) |

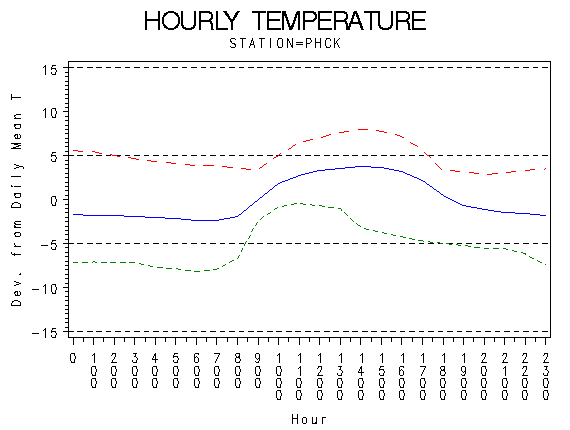 |
| Hourly Max Min and Mean Temperatures (deg. C) |

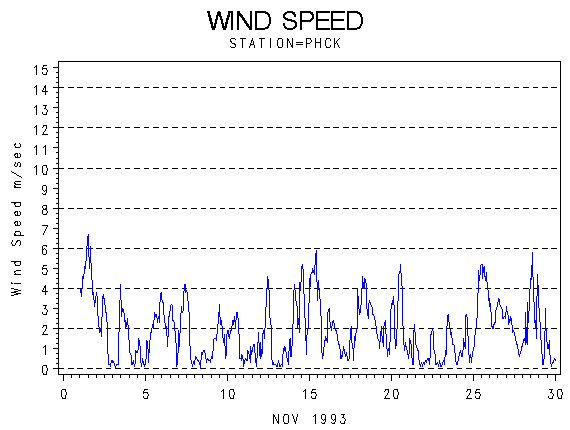 |
| Wind Speed (m/s) |

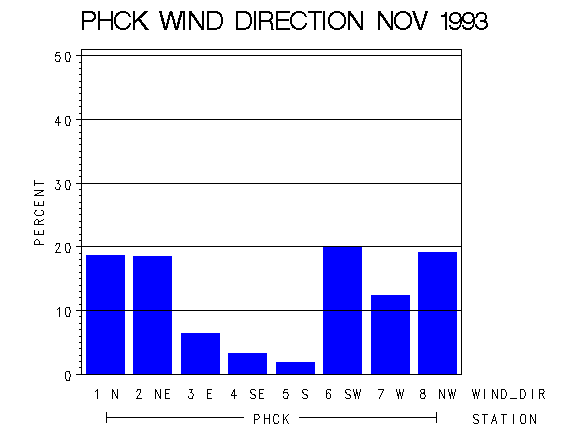 |
| Frequency of Wind Direction |

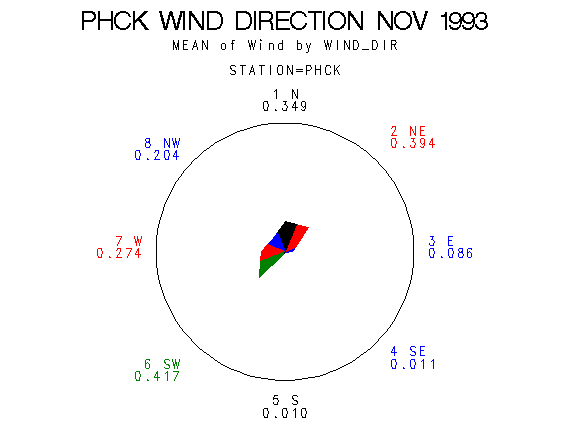 |
| Wind Vectors (circle=1.5 m/s) |

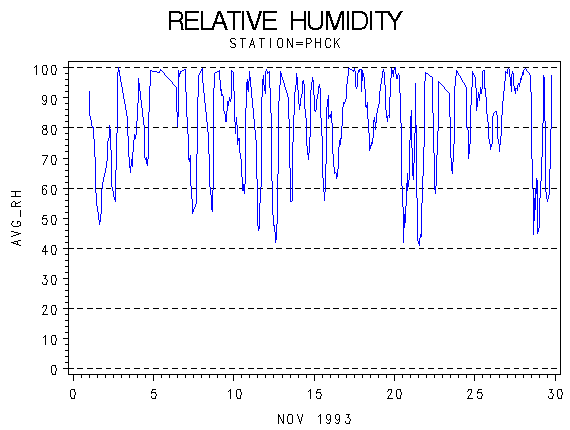 |
| Relative Humidity (percent) |

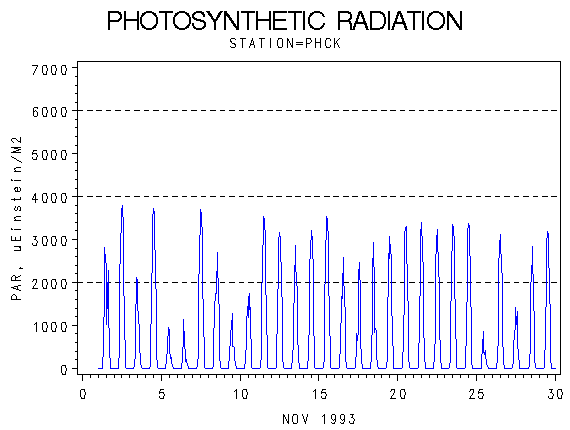 |
| Photosynthetically Active Radiation (micro-einsteins per m squared) |

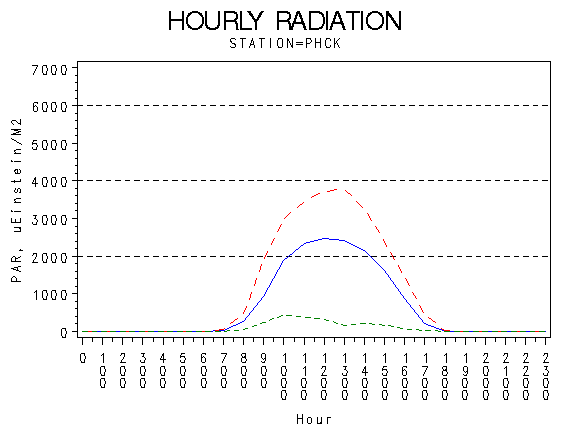 |
| Hourly Photosynthetically Active Radiation (micro-einsteins per m squared) |

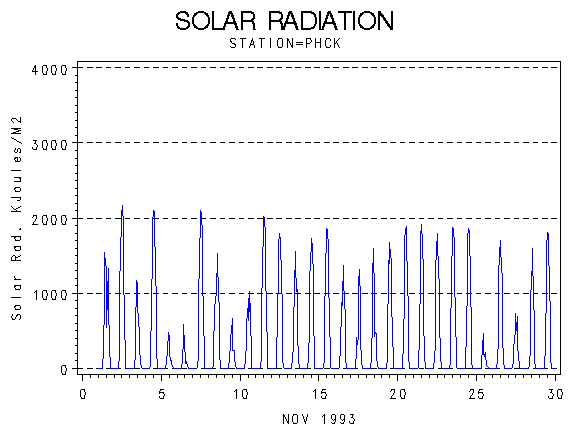 |
| Solar Radiation (KiloJoules per Meter Squared) |

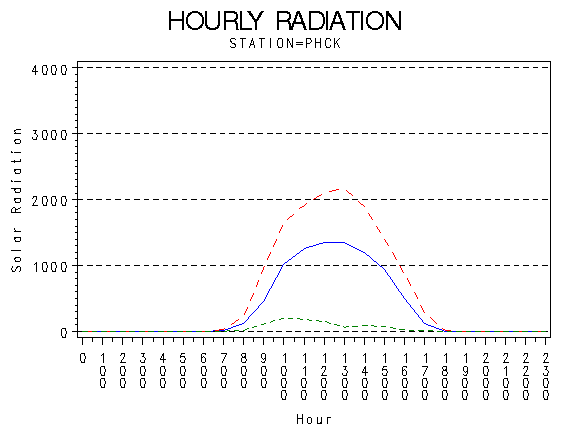 |
| Hourly Solar Radiation (KiloJoules per Meter Squared) |

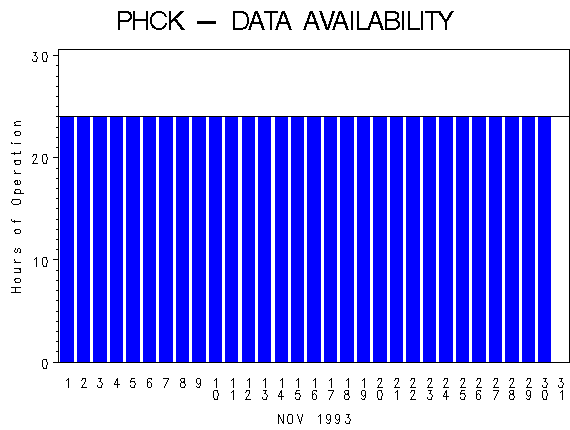 |
| Hours of Station Operation |

 |
| Data Logger Battery Voltage and Internal Logger Temperature |
