

| VIRGINIA COAST RESERVE LONG-TERM ECOLOGICAL RESEARCH |
Site PHCK, Month JUL, Year 1993 |

| 
|
| Day of Month | Precip (mm) | Max Temp. oC | Min Temp. oC | Mean Temp. oC | Wind Speed (m/s) | Wind Dir (deg.) | Vapor Press. (mb) | Solar Rad. KJ/m2 | PAR uE/m2 |
|---|---|---|---|---|---|---|---|---|---|
| 10 | 0.00 | 37 | 26 | 32.4 | 1.35 | 279 | 31.24 | 8887 | 36911 |
| 11 | 0.30 | 36 | 25 | 30.6 | 2.00 | 291 | 32.84 | 13205 | 47240 |
| 12 | 0.00 | 35 | 24 | 29.5 | 1.96 | 292 | 29.36 | 14205 | 48361 |
| 13 | 0.00 | 34 | 23 | 29.3 | 2.11 | 297 | 28.79 | 14658 | 48976 |
| 14 | 0.80 | 32 | 23 | 26.1 | 0.74 | 77 | 28.84 | 5794 | 34042 |
| 16 | 0.00 | 31 | 20 | 26.8 | 1.50 | 259 | 23.16 | 24906 | 42693 |
| 17 | 0.00 | 29 | 18 | 24.0 | 1.68 | 354 | 19.47 | 28543 | 51674 |
| 18 | 0.00 | 29 | 17 | 24.4 | 0.58 | 162 | 21.03 | 23954 | 43826 |
| 19 | 3.10 | 28 | 21 | 25.6 | 2.31 | 218 | 29.84 | 10182 | 20158 |
| 20 | 0.00 | 32 | 23 | 27.8 | 2.44 | 300 | 30.11 | 24613 | 45001 |
| 21 | 0.00 | 29 | 21 | 25.8 | 1.29 | 72 | 25.53 | 25751 | 47057 |
| 22 | 0.00 | 29 | 16 | 24.6 | 1.35 | 15 | 22.57 | 21379 | 38887 |
| 23 | 0.00 | 29 | 15 | 22.8 | 1.14 | 269 | 19.53 | 21398 | 39395 |
| 24 | 0.00 | 29 | 20 | 25.0 | 0.74 | 185 | 28.34 | 23332 | 43617 |
| 25 | 0.00 | 29 | 25 | 26.4 | 1.11 | 77 | 31.33 | 21784 | 40657 |
| 26 | 0.00 | 28 | 24 | 25.7 | 1.05 | 83 | 27.69 | 18663 | 34629 |
| 27 | 0.00 | 30 | 24 | 26.4 | 2.49 | 229 | 28.19 | 13291 | 25131 |
| 28 | 0.00 | 33 | 24 | 28.0 | 1.68 | 247 | 29.01 | 26321 | 48496 |
| 29 | 0.00 | 36 | 24 | 29.7 | 1.63 | 251 | 31.48 | 24498 | 44816 |
| 30 | 0.00 | 33 | 20 | 27.2 | 1.43 | 288 | 23.59 | 26015 | 47066 |
| 31 | 0.00 | 27 | 19 | 24.2 | 1.81 | 330 | 21.22 | 17821 | 33678 |
| Mon. Tot. Precip. 4.2 mm | Mean wind vel. 1.542 m/s |
| Mon. Mean Temp. 26.8 deg. C | Wind dir 285 deg |
| Mean Max. Temp. 31.2 deg. C | Mean Min. Temp. 21.5 deg. C |
| Extreme Max. Temp 36.6 deg. C | Mean vapor press 26.82 mb |
| Extreme Min. Temp 15.4 deg. C | Total Solar Rad 409196 KJ/sq. m |
| Total photosyn. 862311 uEin/sq.m |
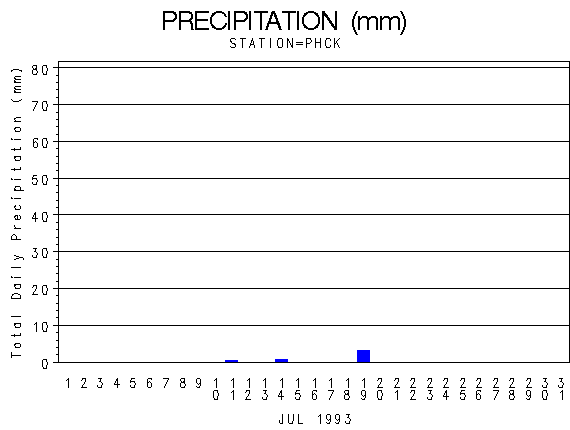 |
| Daily Total Precipitation (mm) |

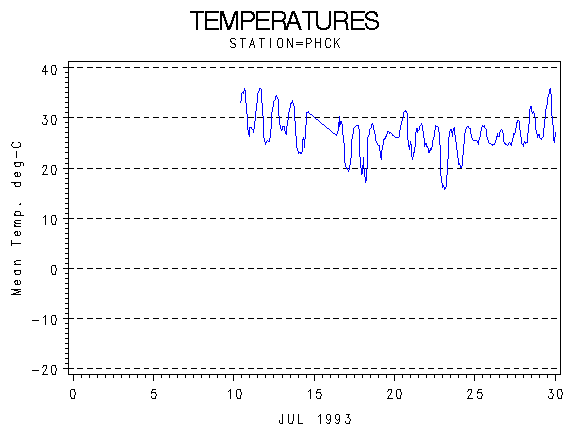 |
| Hourly Mean Temperatures (deg. C) |

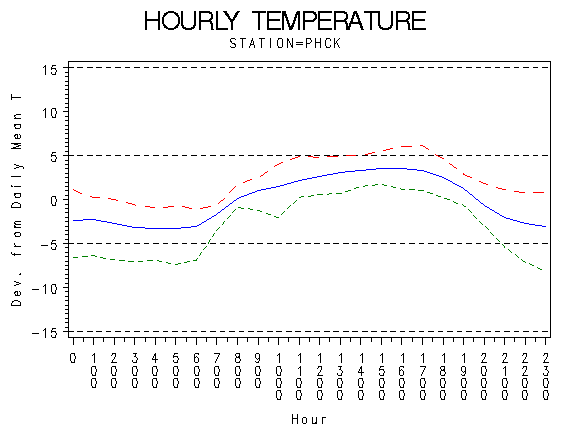 |
| Hourly Max Min and Mean Temperatures (deg. C) |

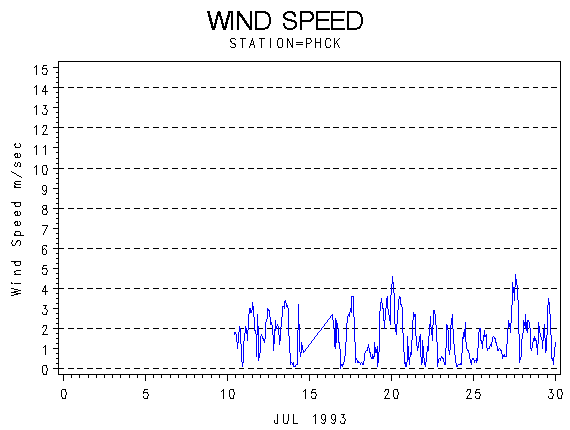 |
| Wind Speed (m/s) |

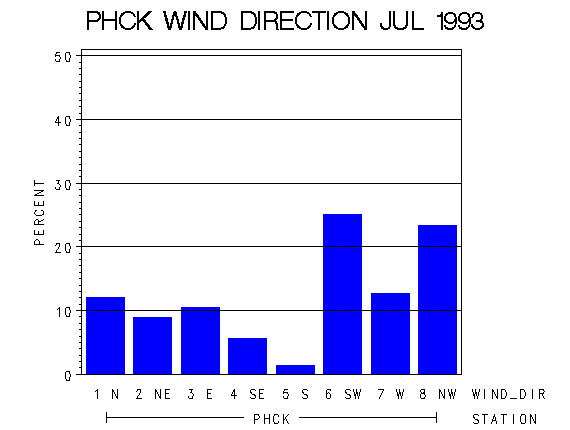 |
| Frequency of Wind Direction |

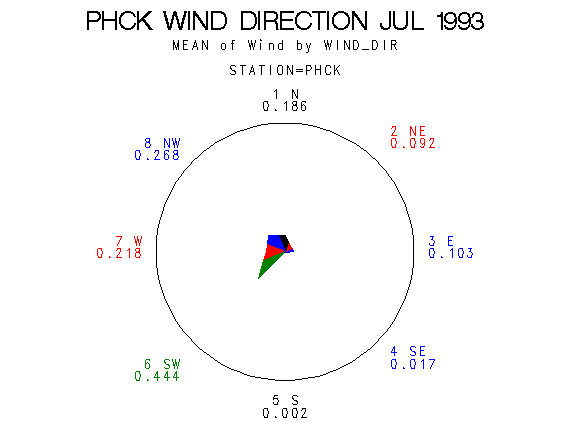 |
| Wind Vectors (circle=1.5 m/s) |

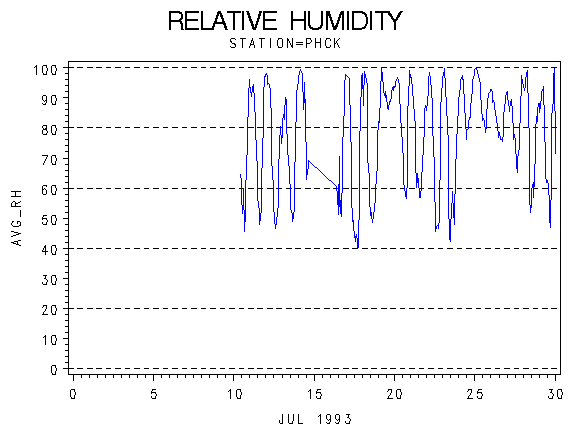 |
| Relative Humidity (percent) |

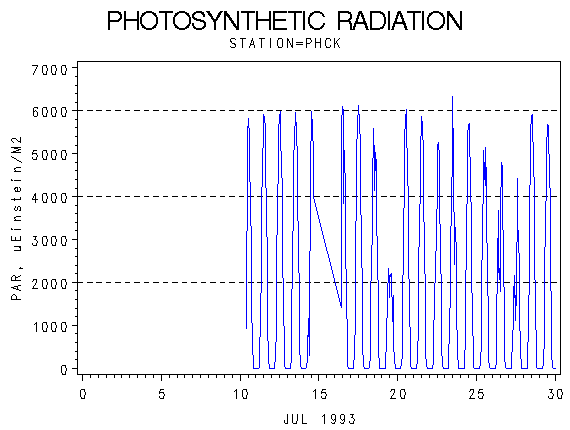 |
| Photosynthetically Active Radiation (micro-einsteins per m squared) |

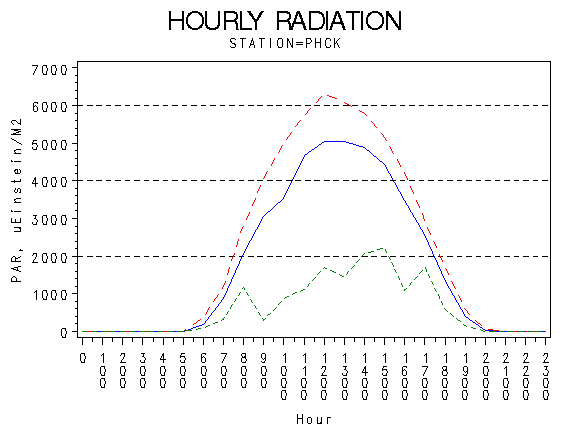 |
| Hourly Photosynthetically Active Radiation (micro-einsteins per m squared) |

 |
| Solar Radiation (KiloJoules per Meter Squared) |

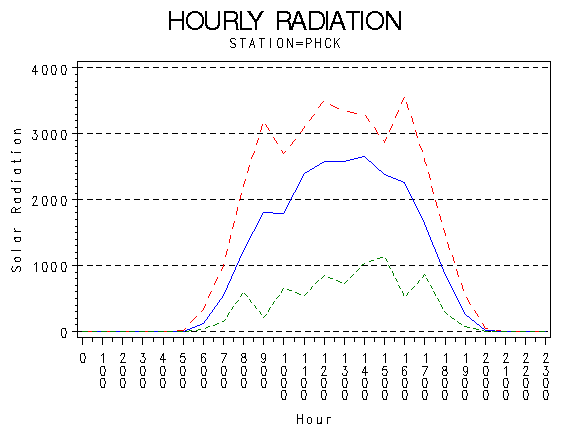 |
| Hourly Solar Radiation (KiloJoules per Meter Squared) |

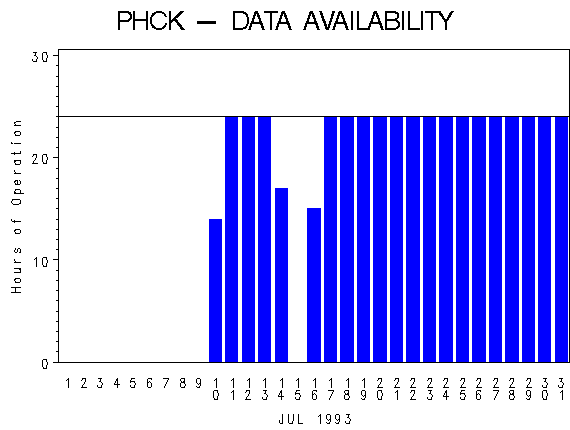 |
| Hours of Station Operation |

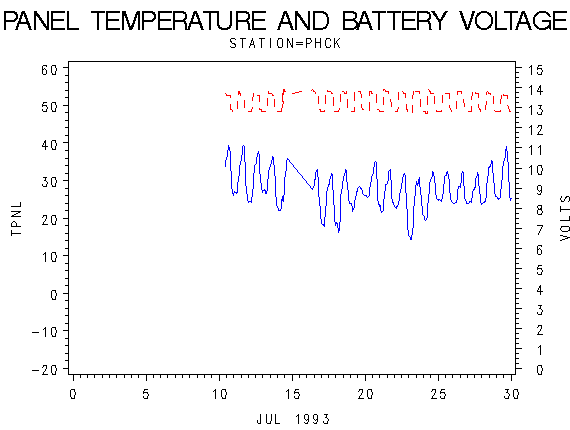 |
| Data Logger Battery Voltage and Internal Logger Temperature |
