

| VIRGINIA COAST RESERVE LONG-TERM ECOLOGICAL RESEARCH |
Site PHCK, Month AUG, Year 1992 |

| 
|
| Day of Month | Precip (mm) | Max Temp. oC | Min Temp. oC | Mean Temp. oC | Wind Speed (m/s) | Wind Dir (deg.) | Vapor Press. (mb) | Solar Rad. KJ/m2 | PAR uE/m2 |
|---|---|---|---|---|---|---|---|---|---|
| 1 | 0.00 | 25 | 16 | 21.9 | 2.54 | 340 | 20.02 | 26374 | 48650 |
| 2 | 0.00 | 27 | 13 | 21.2 | 0.56 | 200 | 18.63 | 25281 | 1758 |
| 3 | 2.30 | 28 | 21 | 24.2 | 0.83 | 186 | 27.02 | 21206 | 553 |
| 4 | 20.60 | 30 | 19 | 24.1 | 2.12 | 246 | 27.15 | 17733 | 2297 |
| 5 | 0.30 | 26 | 17 | 22.3 | 0.82 | 50 | 21.51 | 25712 | 3883 |
| 6 | 6.80 | 24 | 19 | 21.1 | 0.74 | 62 | 22.23 | 9608 | 7542 |
| 7 | 0.00 | 26 | 20 | 22.8 | 1.74 | 65 | 23.35 | 18298 | 3516 |
| 8 | 0.00 | 27 | 17 | 22.9 | 0.55 | 97 | 24.33 | 24415 | 1242 |
| 9 | 4.10 | 31 | 22 | 24.9 | 2.46 | 232 | 28.54 | 15179 | 189 |
| 10 | 0.30 | 31 | 20 | 26.1 | 1.60 | 243 | 27.39 | 23611 | 13123 |
| 11 | 22.40 | 33 | 22 | 26.9 | 2.53 | 238 | 29.25 | 22728 | 10137 |
| 12 | 4.40 | 28 | 22 | 24.0 | 1.49 | 355 | 24.56 | 17393 | 17291 |
| 13 | 34.60 | 25 | 18 | 22.1 | 1.70 | 54 | 24.93 | 3829 | 7603 |
| 14 | 19.60 | 23 | 18 | 20.1 | 2.68 | 44 | 22.96 | 7431 | 14456 |
| 15 | 19.90 | 25 | 20 | 22.4 | 1.64 | 233 | 26.57 | 7136 | 521 |
| 16 | 22.10 | 24 | 21 | 21.9 | 0.70 | 217 | 26.15 | 5169 | 4264 |
| 17 | 20.10 | 26 | 21 | 23.1 | 0.39 | 215 | 27.86 | 9727 | 28 |
| 18 | 4.00 | 27 | 20 | 23.1 | 0.85 | 311 | 25.79 | 18779 | 467 |
| 19 | 0.30 | 29 | 20 | 24.4 | 1.12 | 259 | 27.25 | 19900 | 2903 |
| 20 | 0.00 | 25 | 17 | 21.4 | 1.05 | 46 | 22.00 | 12430 | 13907 |
| 21 | 0.00 | 25 | 17 | 20.7 | 1.09 | 57 | 19.02 | 23007 | 31461 |
| 22 | 0.00 | 25 | 15 | 19.9 | 0.64 | 63 | 19.14 | 20446 | 10645 |
| 23 | 0.00 | 25 | 15 | 20.5 | 0.86 | 67 | 20.30 | 22392 | 9405 |
| 24 | 0.00 | 27 | 14 | 21.5 | 0.46 | 108 | 22.58 | 21128 | 13000 |
| 25 | 0.00 | 30 | 18 | 24.2 | 1.25 | 254 | 25.79 | 21181 | 20422 |
| 26 | 0.00 | 31 | 20 | 25.5 | 1.18 | 279 | 28.80 | 17788 | 10967 |
| 27 | 0.00 | 32 | 22 | 26.3 | 1.26 | 258 | 28.49 | 19895 | 28846 |
| 28 | 9.40 | 30 | 22 | 24.9 | 2.45 | 228 | 28.47 | 18464 | 28394 |
| 29 | 0.00 | 25 | 16 | 21.6 | 1.88 | 325 | 17.96 | 23019 | 25323 |
| 30 | 0.00 | 26 | 12 | 20.0 | 1.15 | 220 | 18.24 | 23555 | 6629 |
| 31 | 0.00 | 29 | 20 | 23.7 | 1.66 | 260 | 23.52 | 20131 | 5813 |
| Mon. Tot. Precip. 191.2 mm | Mean wind vel. 1.354 m/s |
| Mon. Mean Temp. 22.9 deg. C | Wind dir 283 deg |
| Mean Max. Temp. 27.2 deg. C | Mean Min. Temp. 18.5 deg. C |
| Extreme Max. Temp 32.7 deg. C | Mean vapor press 24.19 mb |
| Extreme Min. Temp 11.6 deg. C | Total Solar Rad 562944 KJ/sq. m |
| Total photosyn. 345233 uEin/sq.m |
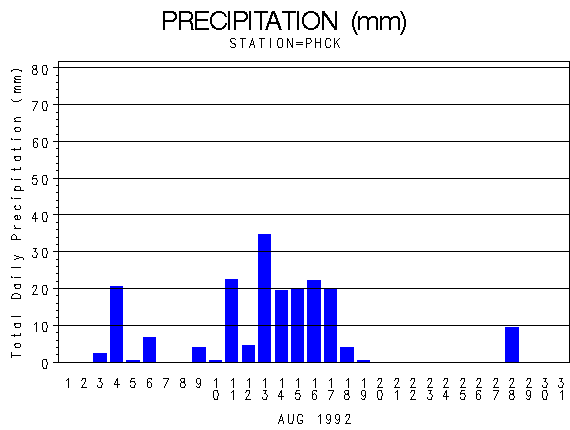 |
| Daily Total Precipitation (mm) |

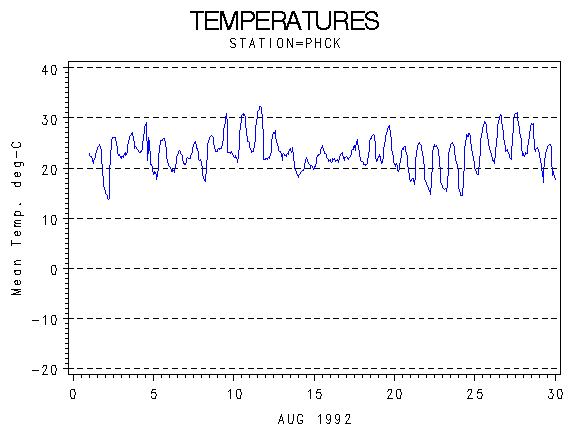 |
| Hourly Mean Temperatures (deg. C) |

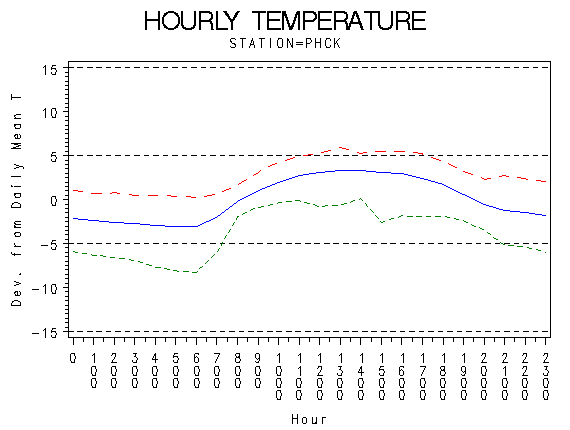 |
| Hourly Max Min and Mean Temperatures (deg. C) |

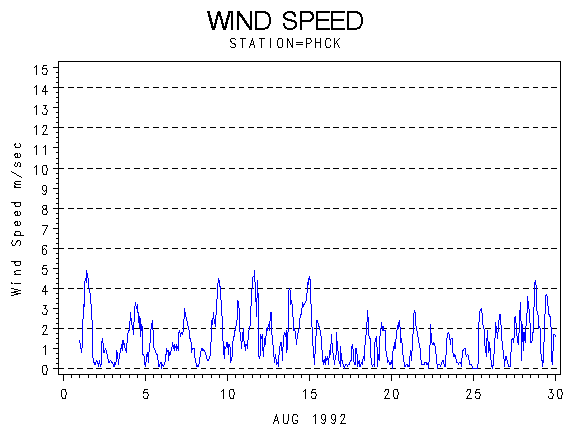 |
| Wind Speed (m/s) |

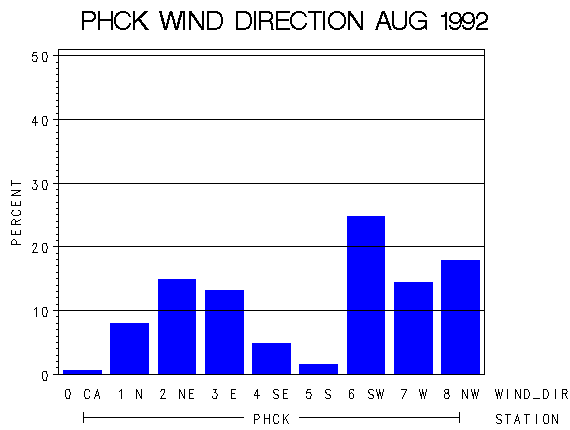 |
| Frequency of Wind Direction |

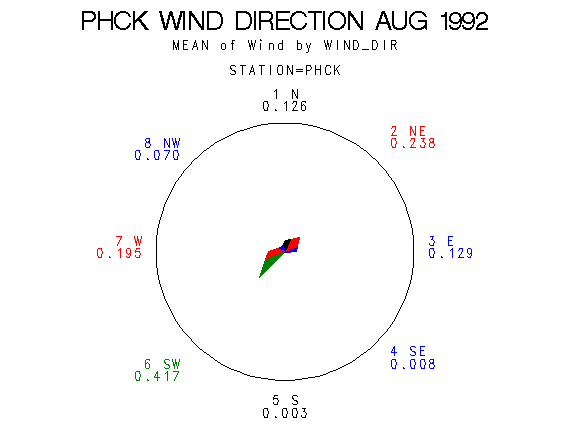 |
| Wind Vectors (circle=1.5 m/s) |

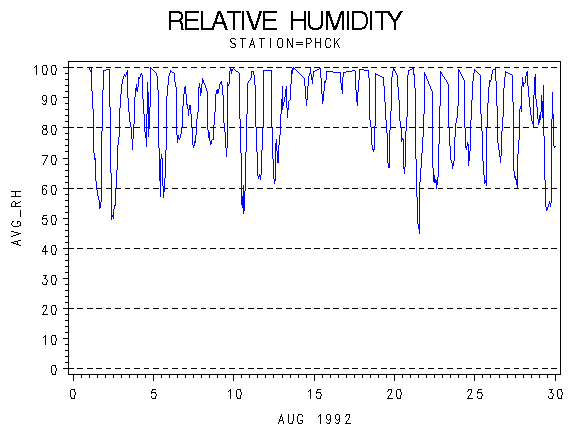 |
| Relative Humidity (percent) |

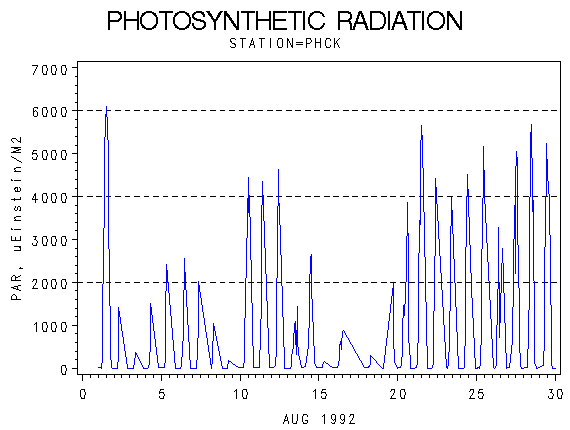 |
| Photosynthetically Active Radiation (micro-einsteins per m squared) |

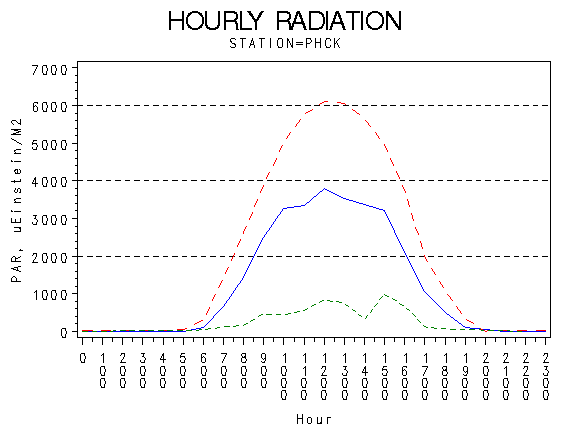 |
| Hourly Photosynthetically Active Radiation (micro-einsteins per m squared) |

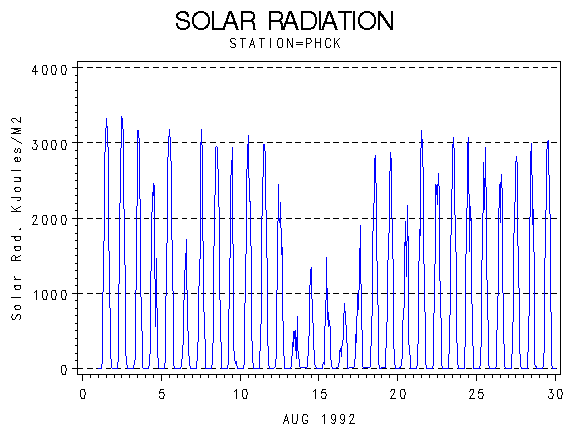 |
| Solar Radiation (KiloJoules per Meter Squared) |

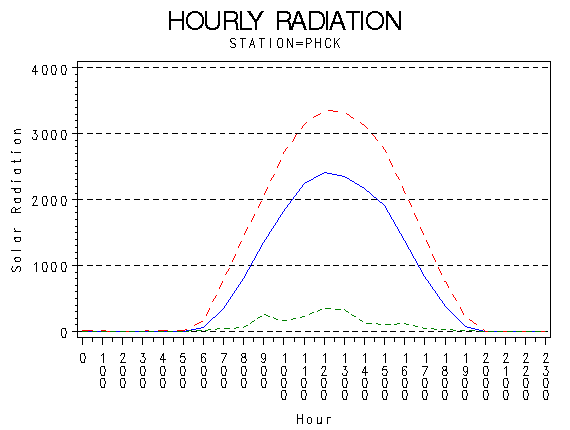 |
| Hourly Solar Radiation (KiloJoules per Meter Squared) |

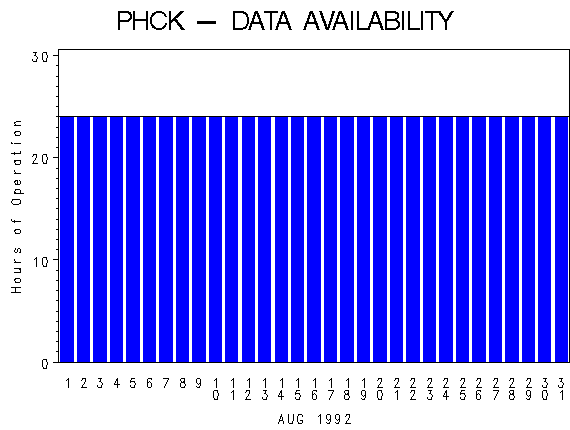 |
| Hours of Station Operation |

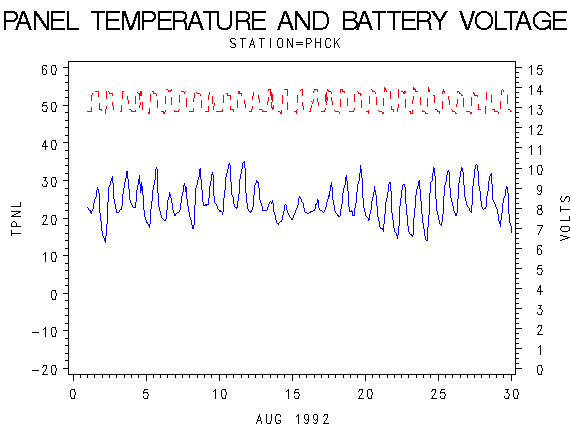 |
| Data Logger Battery Voltage and Internal Logger Temperature |
