
|
| VIRGINIA COAST RESERVE LONG-TERM ECOLOGICAL RESEARCH |
Site PHCK, Month JUN, Year 1992 |

| 
|
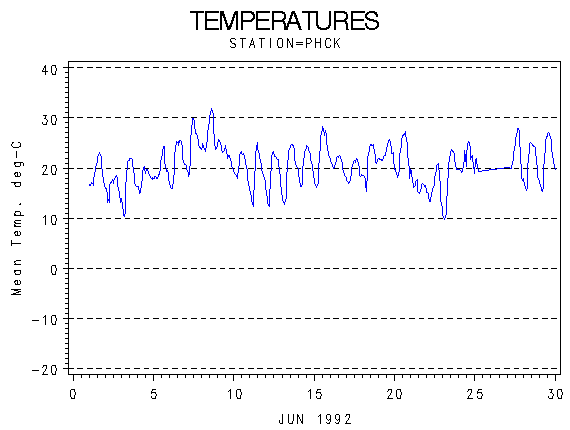
| Day of Month | Precip (mm) | Max Temp. oC | Min Temp. oC | Mean Temp. oC | Wind Speed (m/s) | Wind Dir (deg.) | Vapor Press. (mb) | Solar Rad. KJ/m2 | PAR uE/m2 |
|---|---|---|---|---|---|---|---|---|---|
| 1 | 0.00 | 24 | 16 | 19.2 | 2.78 | 326 | 16.20 | 27767 | 49277 |
| 2 | 0.00 | 19 | 12 | 16.2 | 0.86 | 71 | 16.09 | 19941 | 35793 |
| 3 | 0.00 | 22 | 10 | 17.3 | 0.65 | 108 | 15.53 | 28064 | 49850 |
| 4 | 1.20 | 21 | 14 | 18.0 | 0.74 | 87 | 19.11 | 8729 | 16954 |
| 5 | 21.50 | 25 | 17 | 19.9 | 1.18 | 184 | 22.30 | 16389 | 31274 |
| 6 | 0.00 | 26 | 16 | 21.5 | 0.83 | 237 | 23.04 | 26855 | 50157 |
| 7 | 0.00 | 31 | 18 | 24.4 | 1.14 | 221 | 25.63 | 23308 | 43383 |
| 8 | 0.30 | 32 | 23 | 26.6 | 2.72 | 238 | 27.46 | 24889 | 46739 |
| 9 | 2.90 | 26 | 20 | 23.1 | 2.00 | 265 | 26.23 | 6543 | 13828 |
| 10 | 0.00 | 24 | 16 | 20.2 | 1.78 | 56 | 18.81 | 26245 | 48841 |
| 11 | 0.00 | 26 | 12 | 18.8 | 1.03 | 59 | 17.22 | 19165 | 35751 |
| 12 | 0.00 | 24 | 12 | 18.7 | 0.73 | 83 | 15.71 | 25980 | 47033 |
| 13 | 0.00 | 25 | 13 | 19.8 | 0.58 | 104 | 18.76 | 26648 | 48735 |
| 14 | 0.00 | 25 | 16 | 20.8 | 0.35 | 114 | 20.27 | 15519 | 30071 |
| 15 | 0.30 | 29 | 16 | 22.7 | 0.93 | 322 | 22.98 | 23149 | 43003 |
| 16 | 0.00 | 23 | 18 | 20.8 | 2.11 | 79 | 19.20 | 25645 | 47387 |
| 17 | 0.00 | 23 | 17 | 19.4 | 0.88 | 98 | 15.07 | 28383 | 50734 |
| 18 | 0.00 | 25 | 15 | 21.4 | 0.92 | 186 | 18.47 | 29497 | 53304 |
| 19 | 0.00 | 26 | 21 | 23.0 | 2.55 | 220 | 23.66 | 15365 | 29487 |
| 20 | 0.00 | 28 | 17 | 22.5 | 1.37 | 318 | 21.48 | 22394 | 41550 |
| 21 | 25.70 | 20 | 15 | 16.7 | 1.73 | 15 | 16.57 | 3875 | 8466 |
| 22 | 0.00 | 21 | 11 | 16.2 | 2.71 | 328 | 11.67 | 26988 | 48563 |
| 23 | 0.00 | 24 | 9 | 18.1 | 1.53 | 229 | 14.69 | 28146 | 51123 |
| 24 | 12.00 | 26 | 19 | 21.6 | 2.13 | 220 | 22.73 | 16266 | 30643 |
| 25 | 5.90 | 22 | 18 | 20.5 | 1.72 | 254 | 23.67 | . | 137 |
| 27 | 0.00 | 28 | 17 | 22.6 | 1.75 | 324 | 22.36 | 22166 | 40353 |
| 28 | 0.00 | 25 | 15 | 20.9 | 0.80 | 44 | 19.68 | 27664 | 49926 |
| 29 | 0.00 | 28 | 15 | 21.9 | 0.59 | 176 | 19.51 | 27497 | 49513 |
| 30 | 0.00 | 30 | 16 | 23.5 | 1.75 | 226 | 21.60 | 26035 | 47532 |
| Mon. Tot. Precip. 69.8 mm | Mean wind vel. 1.408 m/s |
| Mon. Mean Temp. 20.6 deg. C | Wind dir 274 deg |
| Mean Max. Temp. 25.1 deg. C | Mean Min. Temp. 15.6 deg. C |
| Extreme Max. Temp 32.4 deg. C | Mean vapor press 19.85 mb |
| Extreme Min. Temp 9.4 deg. C | Total Solar Rad 619113 KJ/sq. m |
| Total photosyn. 1139403 uEin/sq.m |
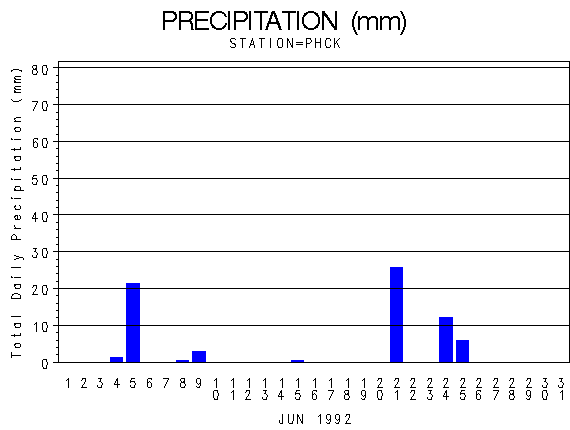 |
| Daily Total Precipitation (mm) |

 |
| Hourly Mean Temperatures (deg. C) |
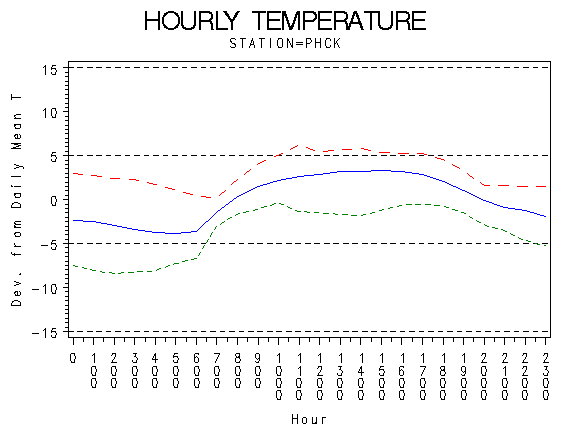 |
| Hourly Max Min and Mean Temperatures (deg. C) |
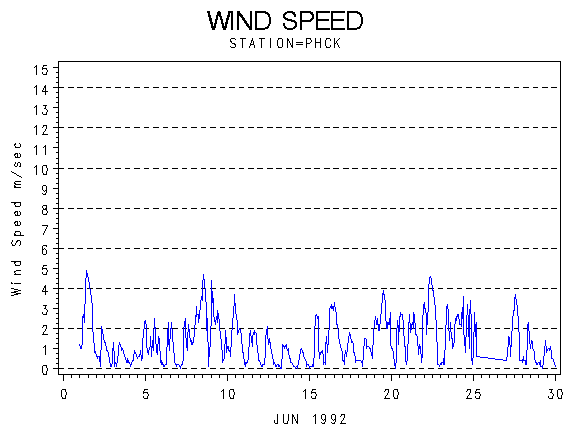 |
| Wind Speed (m/s) |
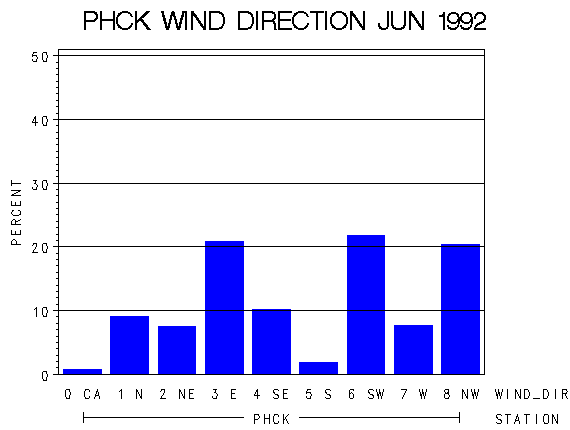 |
| Frequency of Wind Direction |
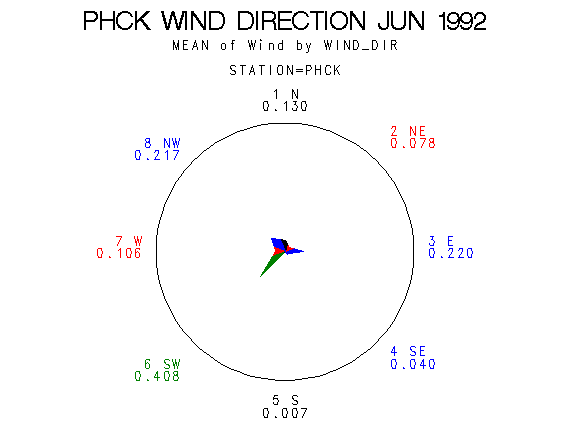 |
| Wind Vectors (circle=1.5 m/s) |
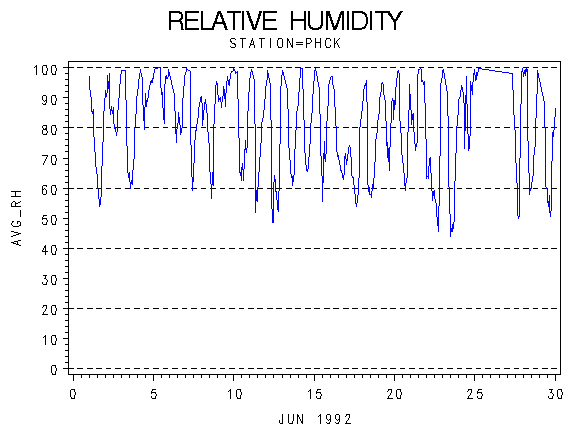 |
| Relative Humidity (percent) |
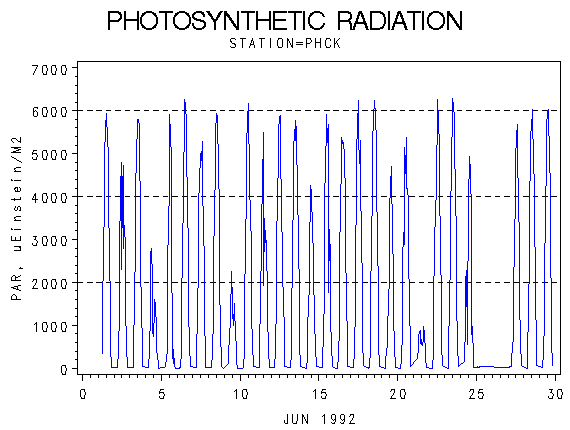 |
| Photosynthetically Active Radiation (micro-einsteins per m squared) |
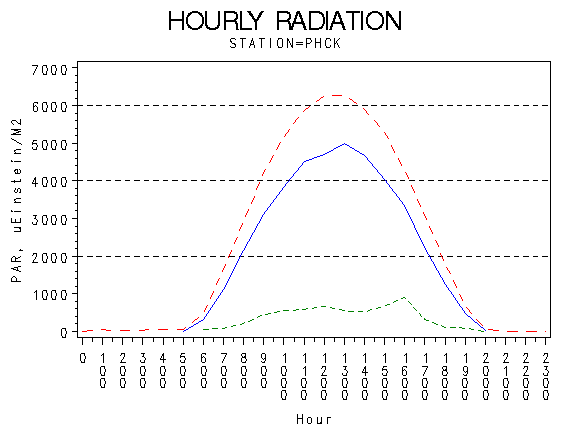 |
| Hourly Photosynthetically Active Radiation (micro-einsteins per m squared) |
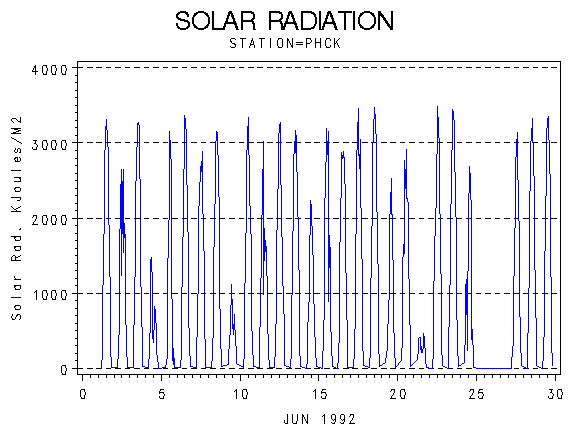 |
| Solar Radiation (KiloJoules per Meter Squared) |
 |
| Hourly Solar Radiation (KiloJoules per Meter Squared) |
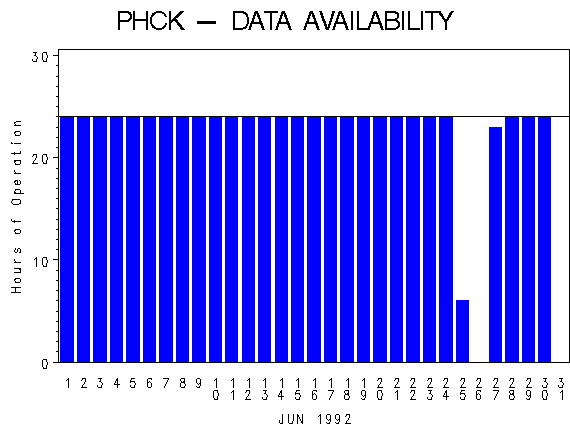 |
| Hours of Station Operation |
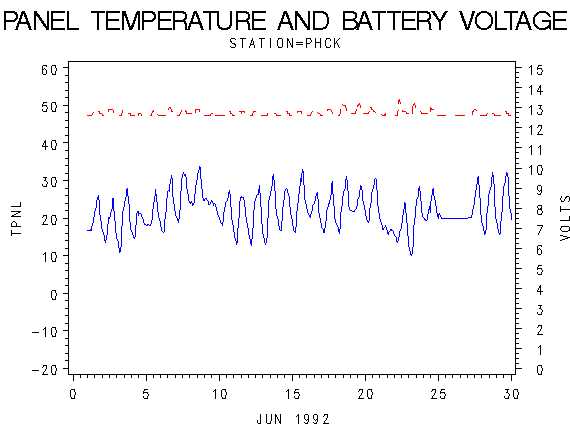 |
| Data Logger Battery Voltage and Internal Logger Temperature |