

| VIRGINIA COAST RESERVE LONG-TERM ECOLOGICAL RESEARCH |
Site PHCK, Month MAY, Year 1992 |

| 
|
| Day of Month | Precip (mm) | Max Temp. oC | Min Temp. oC | Mean Temp. oC | Wind Speed (m/s) | Wind Dir (deg.) | Vapor Press. (mb) | Solar Rad. KJ/m2 | PAR uE/m2 |
|---|---|---|---|---|---|---|---|---|---|
| 1 | 0.00 | 19 | 9 | 14.6 | 1.19 | 328 | 13.42 | 21364 | 38380 |
| 2 | 0.00 | 29 | 13 | 20.9 | 4.79 | 228 | 15.01 | 24521 | 44214 |
| 3 | 0.00 | 25 | 16 | 21.0 | 2.74 | 298 | 13.61 | 22547 | 40651 |
| 4 | 0.00 | 19 | 10 | 15.3 | 2.92 | 347 | 9.55 | 23455 | 42432 |
| 5 | 9.00 | 12 | 8 | 10.1 | 1.37 | 65 | 10.93 | 5456 | 10821 |
| 6 | 0.00 | 11 | 8 | 8.9 | 4.98 | 58 | 8.83 | 12549 | 23410 |
| 7 | 28.90 | 10 | 8 | 8.9 | 6.25 | 57 | 10.24 | 3231 | 8144 |
| 8 | 35.90 | 17 | 10 | 13.5 | 2.52 | 63 | 15.52 | 13749 | 28250 |
| 9 | 0.30 | 18 | 11 | 14.3 | 1.26 | 211 | 14.11 | 16855 | 31368 |
| 10 | 0.00 | 21 | 10 | 15.2 | 2.12 | 310 | 13.37 | 22298 | 41286 |
| 11 | 0.00 | 20 | 11 | 14.8 | 2.60 | 53 | 13.83 | 25726 | 46658 |
| 12 | 0.00 | 17 | 11 | 13.3 | 2.09 | 44 | 13.14 | 15442 | 29029 |
| 13 | 0.00 | 17 | 12 | 14.2 | 0.93 | 30 | 15.31 | 9086 | 17446 |
| 14 | 0.00 | 24 | 13 | 17.7 | 1.24 | 245 | 18.29 | 22983 | 42225 |
| 15 | 0.30 | 18 | 14 | 15.9 | 1.12 | 73 | 17.78 | 6385 | 12996 |
| 16 | 0.00 | 19 | 13 | 15.1 | 1.95 | 71 | 16.78 | 16282 | 31003 |
| 17 | 0.00 | 17 | 12 | 13.6 | 1.50 | 73 | 15.31 | 15492 | 29249 |
| 18 | 0.00 | 29 | 12 | 19.9 | 1.65 | 290 | 18.73 | 21669 | 40222 |
| 19 | 0.00 | 20 | 12 | 15.8 | 4.42 | 57 | 14.65 | 16547 | 30395 |
| 20 | 0.00 | 18 | 8 | 12.5 | 3.34 | 52 | 11.74 | 25546 | 45548 |
| 21 | 0.00 | 25 | 5 | 14.8 | 1.50 | 53 | 8.84 | 29575 | 45503 |
| 22 | 0.00 | 29 | 8 | 18.9 | 1.70 | 333 | 10.39 | 26413 | 41572 |
| 24 | 0.00 | 31 | 16 | 25.3 | 1.77 | 46 | 19.42 | 12235 | 19174 |
| 25 | 0.00 | 16 | 11 | 12.5 | 2.97 | 50 | 12.43 | 4087 | 7797 |
| 26 | 6.50 | 12 | 10 | 11.2 | 2.67 | 55 | 12.62 | 3392 | 7133 |
| 27 | 0.00 | 18 | 9 | 12.1 | 1.43 | 10 | 12.28 | 18620 | 32640 |
| 28 | 0.00 | 21 | 7 | 13.7 | 1.03 | 110 | 11.04 | 23864 | 41463 |
| 29 | 0.00 | 20 | 9 | 14.8 | 1.08 | 82 | 11.89 | 21365 | 37712 |
| 30 | 18.90 | 17 | 15 | 16.1 | 1.02 | 97 | 17.30 | 2689 | 6231 |
| 31 | 32.10 | 24 | 15 | 18.9 | 1.64 | 268 | 19.16 | 15849 | 28952 |
| Mon. Tot. Precip. 131.9 mm | Mean wind vel. 2.260 m/s |
| Mon. Mean Temp. 15.1 deg. C | Wind dir 44 deg |
| Mean Max. Temp. 19.8 deg. C | Mean Min. Temp. 10.8 deg. C |
| Extreme Max. Temp 30.7 deg. C | Mean vapor press 13.85 mb |
| Extreme Min. Temp 5.2 deg. C | Total Solar Rad 499272 KJ/sq. m |
| Total photosyn. 901904 uEin/sq.m |
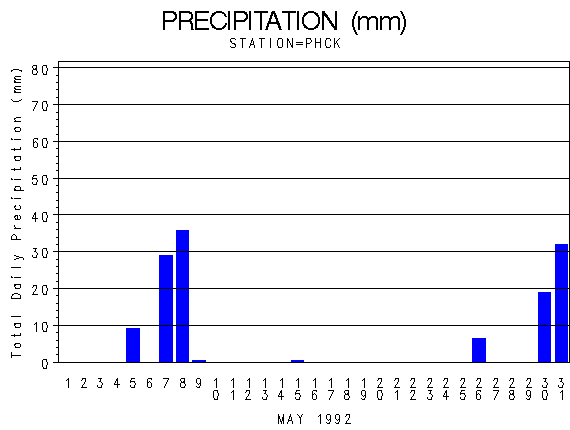 |
| Daily Total Precipitation (mm) |

 |
| Hourly Mean Temperatures (deg. C) |

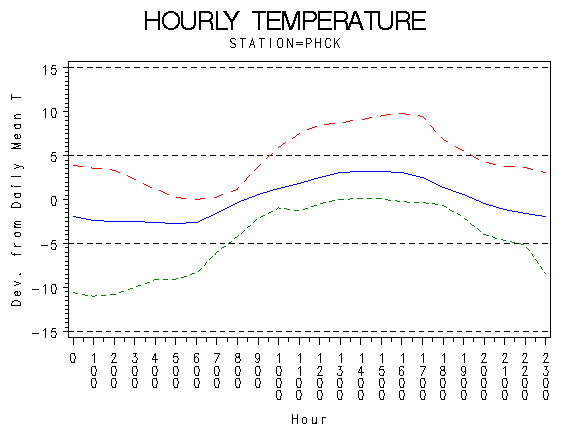 |
| Hourly Max Min and Mean Temperatures (deg. C) |

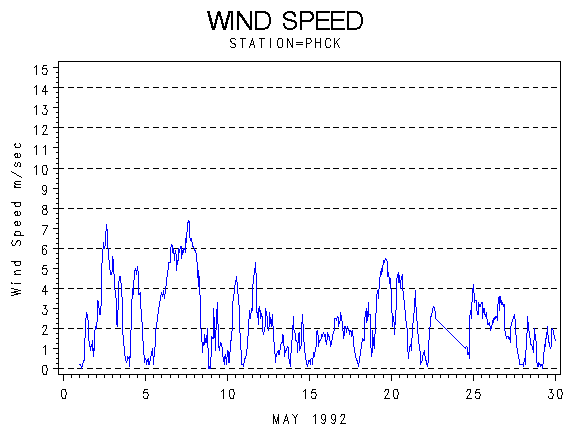 |
| Wind Speed (m/s) |

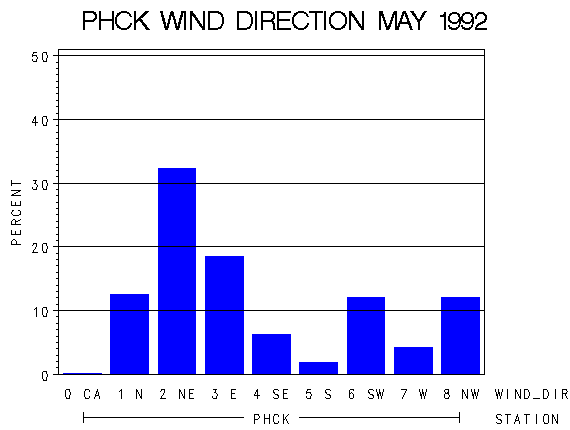 |
| Frequency of Wind Direction |

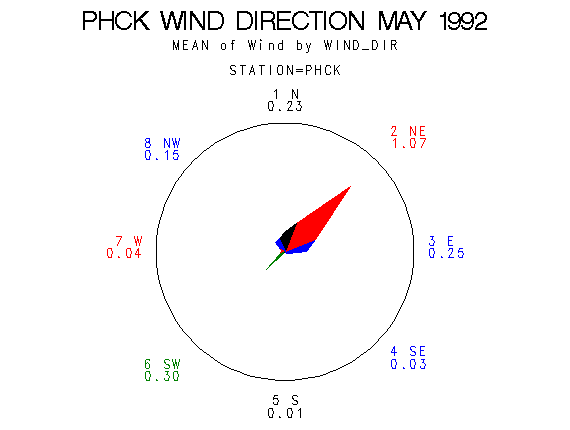 |
| Wind Vectors (circle=1.5 m/s) |

 |
| Relative Humidity (percent) |

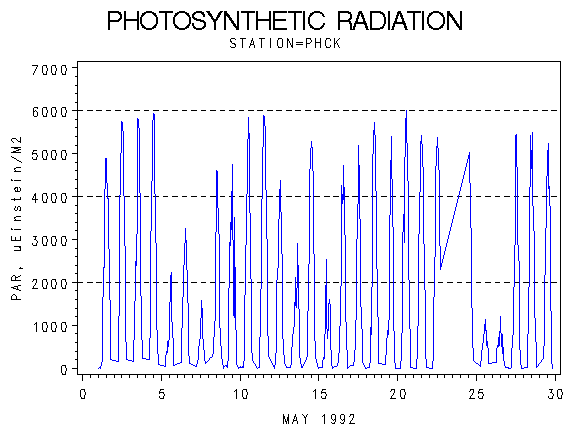 |
| Photosynthetically Active Radiation (micro-einsteins per m squared) |

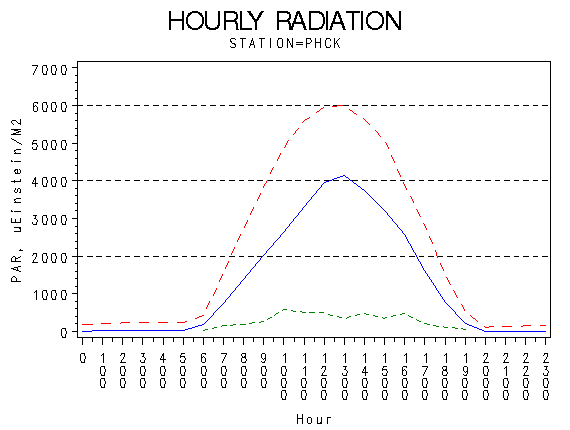 |
| Hourly Photosynthetically Active Radiation (micro-einsteins per m squared) |

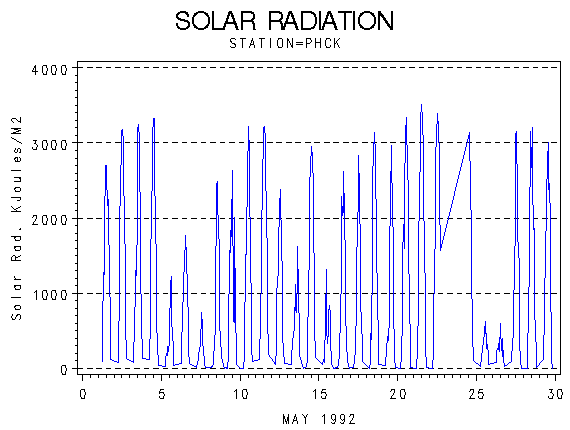 |
| Solar Radiation (KiloJoules per Meter Squared) |

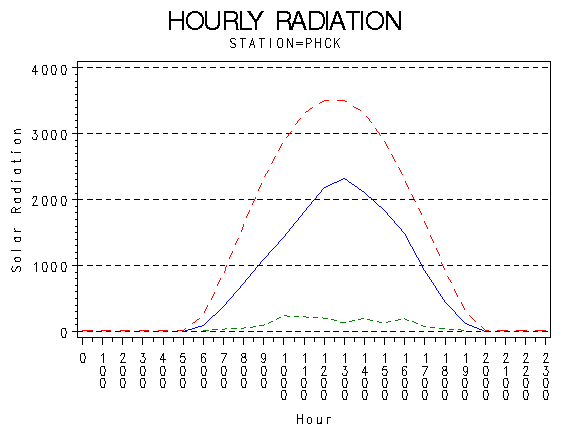 |
| Hourly Solar Radiation (KiloJoules per Meter Squared) |

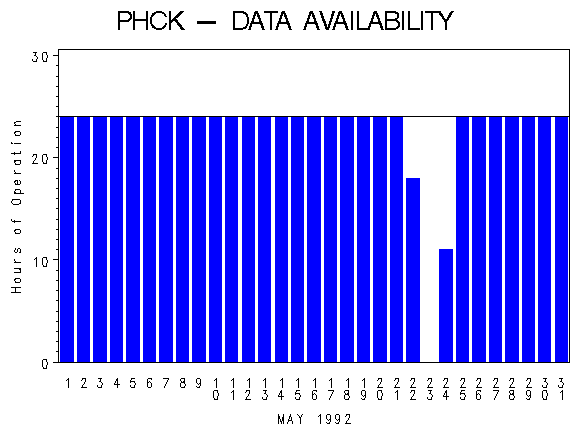 |
| Hours of Station Operation |

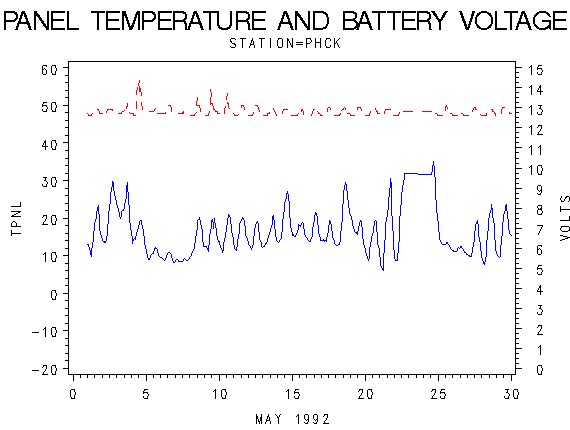 |
| Data Logger Battery Voltage and Internal Logger Temperature |
