
|
| VIRGINIA COAST RESERVE LONG-TERM ECOLOGICAL RESEARCH |
Site OYSM, Month MAY, Year 2000 |

| 
|
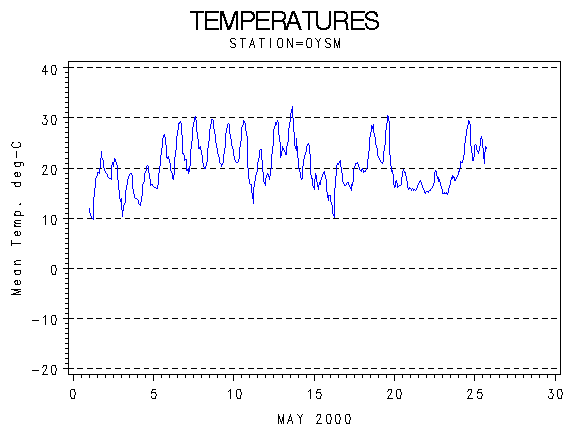
| Day of Month | Precip (mm) | Max Temp. oC | Min Temp. oC | Mean Temp. oC | Wind Speed (m/s) | Wind Dir (deg.) | Vapor Press. (mb) | Solar Rad. KJ/m2 | PAR mMoles/m2 |
|---|---|---|---|---|---|---|---|---|---|
| 1 | 0.00 | 24 | 9 | 16.6 | 2.93 | 203 | 13.37 | . | . |
| 2 | 0.00 | 22 | 13 | 18.7 | 3.54 | 282 | 15.62 | . | . |
| 3 | 0.00 | 19 | 9 | 15.2 | 2.81 | 118 | 13.99 | . | . |
| 4 | 0.00 | 21 | 12 | 16.5 | 3.16 | 167 | 15.76 | . | . |
| 5 | 0.00 | 27 | 16 | 20.9 | 2.79 | 257 | 18.55 | . | . |
| 6 | 0.00 | 30 | 17 | 23.4 | 2.17 | 283 | 21.77 | . | . |
| 7 | 0.00 | 31 | 18 | 24.4 | 2.10 | 256 | 23.39 | . | . |
| 8 | 0.00 | 30 | 20 | 24.6 | 2.64 | 251 | 21.03 | . | . |
| 9 | 0.00 | 29 | 20 | 24.3 | 3.14 | 244 | 21.21 | . | . |
| 10 | 2.54 | 30 | 17 | 24.1 | 3.90 | 254 | 21.47 | . | . |
| 11 | 0.00 | 24 | 12 | 18.6 | 3.10 | 316 | 14.25 | . | . |
| 12 | 0.00 | 30 | 17 | 23.3 | 2.20 | 246 | 22.30 | . | . |
| 13 | 0.00 | 33 | 22 | 26.1 | 2.48 | 272 | 27.51 | . | . |
| 14 | 0.00 | 25 | 16 | 20.7 | 2.49 | 345 | 16.59 | . | . |
| 15 | 0.00 | 20 | 13 | 17.0 | 2.65 | 92 | 11.99 | . | . |
| 16 | 0.00 | 22 | 9 | 16.8 | 2.51 | 169 | 12.34 | . | . |
| 17 | 3.30 | 21 | 15 | 18.6 | 3.11 | 177 | 18.93 | . | . |
| 18 | 0.00 | 29 | 19 | 23.5 | 3.30 | 224 | 21.35 | . | . |
| 19 | 13.97 | 31 | 16 | 23.2 | 3.33 | 264 | 22.52 | . | . |
| 20 | 16.51 | 20 | 16 | 17.2 | 3.00 | 77 | 19.74 | . | . |
| 21 | 1.02 | 18 | 15 | 16.0 | 2.41 | 78 | 18.11 | . | . |
| 22 | 9.65 | 20 | 15 | 16.8 | 3.38 | 67 | 18.79 | . | . |
| 23 | 0.00 | 19 | 15 | 16.6 | 2.97 | 156 | 18.36 | . | . |
| 24 | 0.00 | 30 | 19 | 23.9 | 2.95 | 253 | 23.06 | . | . |
| 25 | 0.51 | 28 | 20 | 24.0 | 2.93 | 281 | 24.83 | . | . |
| Mon. Tot. Precip. 47.5 mm | Mean wind vel. 2.880 m/s |
| Mon. Mean Temp. 20.4 deg. C | Wind dir 231 deg |
| Mean Max. Temp. 25.3 deg. C | Mean Min. Temp. 15.6 deg. C |
| Extreme Max. Temp 33.2 deg. C | Mean vapor press 19.07 mb |
| Extreme Min. Temp 8.8 deg. C | Total Solar Rad . KJ/sq. m |
| Total photosyn. . mMoles/sq.m |
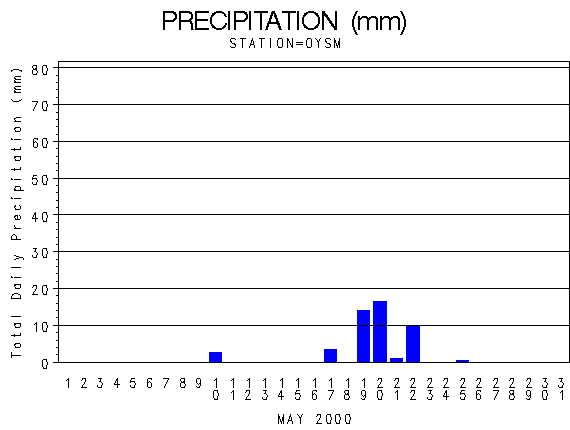 |
| Daily Total Precipitation (mm) |

 |
| Hourly Mean Temperatures (deg. C) |
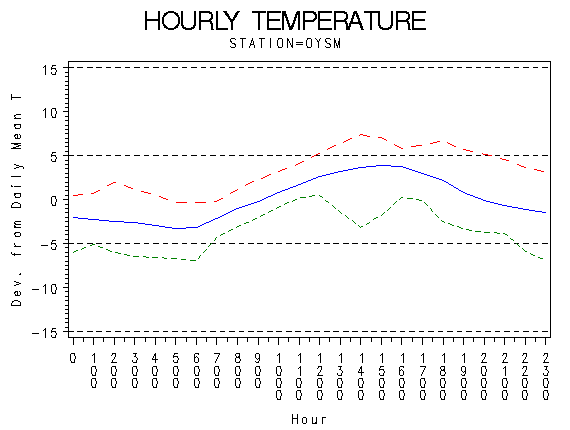 |
| Hourly Max Min and Mean Temperatures (deg. C) |
 |
| Wind Speed (m/s) |
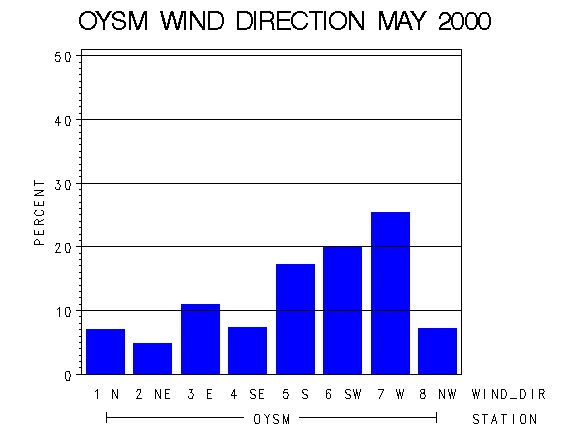 |
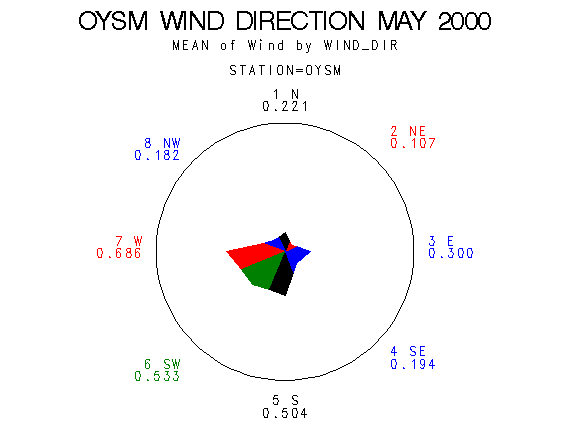
| Frequency of Wind Direction |
 |
| Wind Vectors (circle=1.5 m/s) |
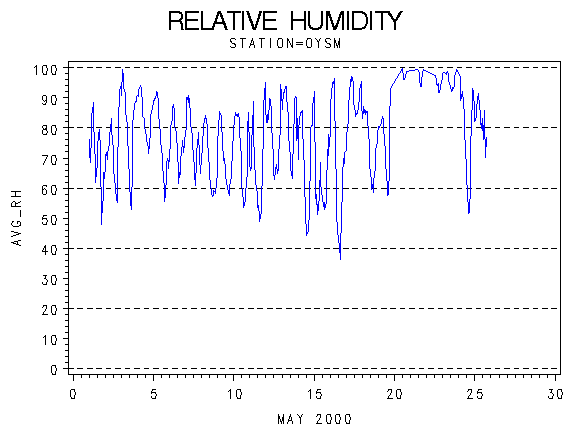 |
| Relative Humidity (percent) |
 |
| Photosynthetically Active Radiation (milli-moles per m squared) |
 |
| Hourly Photosynthetically Active Radiation (milliMoles per m squared) |
 |
| Solar Radiation (KiloJoules per Meter Squared) |
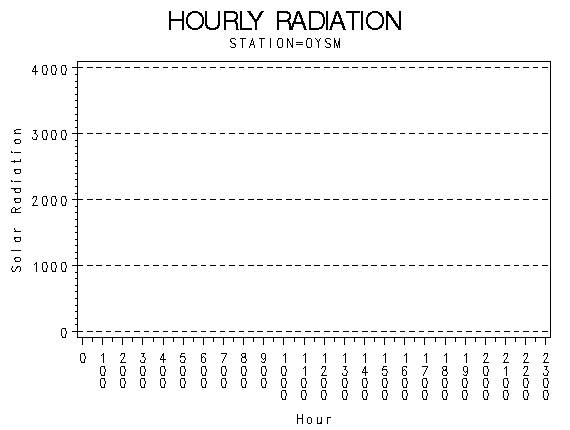 |
| Hourly Solar Radiation (KiloJoules per Meter Squared) |
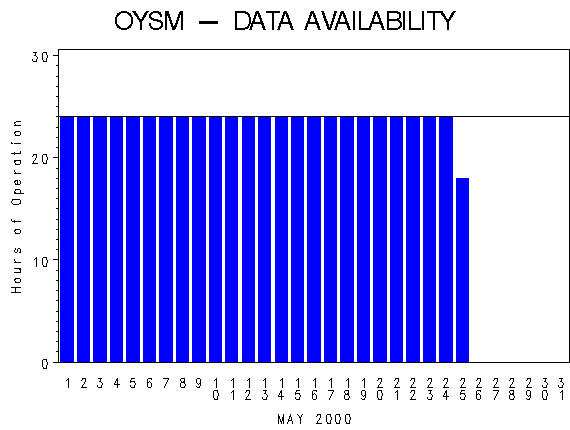 |
| Hours of Station Operation |
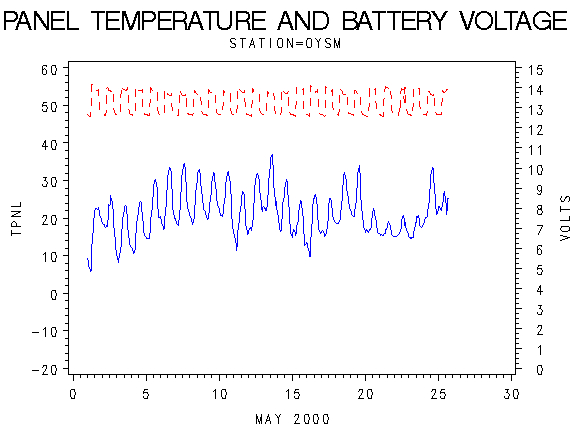 |
| Data Logger Battery Voltage and Internal Logger Temperature |