

| VIRGINIA COAST RESERVE LONG-TERM ECOLOGICAL RESEARCH |
Site HOGI, Month JUN, Year 2003 |

| 
|
| Day of Month | Precip (mm) | Max Temp. oC | Min Temp. oC | Mean Temp. oC | Wind Speed (m/s) | Wind Dir (deg.) | Vapor Press. (mb) | Solar Rad. KJ/m2 | PAR mMoles/m2 |
|---|---|---|---|---|---|---|---|---|---|
| 7 | 0.00 | 34 | 17 | 21.6 | 0.52 | 276 | 23.66 | 6381 | 9385 |
| 8 | 0.00 | 32 | 16 | 19.7 | 0.56 | 207 | 19.57 | 9808 | 13896 |
| 9 | 0.00 | 25 | 16 | 19.6 | 0.24 | 265 | 24.06 | 25289 | 30283 |
| 10 | 0.00 | 25 | 19 | 21.8 | 0.22 | 255 | 24.75 | 27939 | 33816 |
| 11 | 0.00 | 27 | 19 | 23.5 | 0.53 | 288 | 28.58 | 25984 | 32557 |
| 12 | 0.00 | 29 | 23 | 25.6 | 0.42 | 286 | 32.04 | 25715 | 32555 |
| 13 | 0.00 | 34 | 23 | 26.2 | 0.57 | 288 | 33.91 | 23699 | 29183 |
| 14 | 0.00 | 38 | 24 | 29.4 | 0.19 | 296 | 39.94 | 24064 | 29879 |
| 15 | 0.00 | 28 | 19 | 22.5 | 0.25 | 212 | 26.96 | 12154 | 16525 |
| 16 | 0.00 | 24 | 18 | 20.5 | 1.21 | 197 | 23.40 | 26484 | 33017 |
| 17 | 0.00 | 19 | 17 | 18.4 | 1.41 | 202 | 21.26 | 6590 | 9879 |
| 18 | 0.00 | 28 | 19 | 23.2 | 0.04 | 280 | 28.21 | 23159 | 29321 |
| 19 | 0.00 | 25 | 21 | 22.8 | 0.09 | 251 | 28.78 | 8395 | 12043 |
| 20 | 0.00 | 24 | 21 | 21.8 | 0.12 | 295 | 26.48 | 13506 | 17847 |
| 21 | 0.00 | 24 | 19 | 21.1 | 0.57 | 310 | 21.99 | 26667 | 32301 |
| 22 | 0.00 | 24 | 18 | 20.7 | 0.67 | 308 | 21.34 | 24218 | 29408 |
| 23 | 0.00 | 30 | 21 | 24.9 | 0.60 | 308 | 24.05 | 29199 | 34061 |
| 24 | 0.00 | 32 | 20 | 25.2 | 0.05 | 231 | 26.08 | 28271 | 32341 |
| 25 | 0.00 | 34 | 19 | 26.6 | 0.33 | 306 | 27.89 | 29918 | 33464 |
| 26 | 0.00 | 34 | 23 | 28.0 | 0.24 | 306 | 31.12 | 27514 | 30860 |
| 27 | 0.00 | 34 | 24 | 28.2 | 0.23 | 306 | 32.38 | 27155 | 29973 |
| 28 | 0.00 | 26 | 21 | 23.5 | 0.31 | 199 | 24.76 | 21648 | 24337 |
| 29 | 0.00 | 30 | 21 | 25.2 | 0.11 | 277 | 30.82 | 28146 | 29709 |
| 30 | 0.00 | 31 | 24 | 26.7 | 0.16 | 283 | 33.87 | 24755 | 26605 |
| Mon. Tot. Precip. 0.0 mm | Mean wind vel. 0.402 m/s |
| Mon. Mean Temp. 23.6 deg. C | Wind dir 260 deg |
| Mean Max. Temp. 28.8 deg. C | Mean Min. Temp. 20.2 deg. C |
| Extreme Max. Temp 38.3 deg. C | Mean vapor press 27.33 mb |
| Extreme Min. Temp 15.6 deg. C | Total Solar Rad 526658 KJ/sq. m |
| Total photosyn. 633246 mMoles/sq.m |
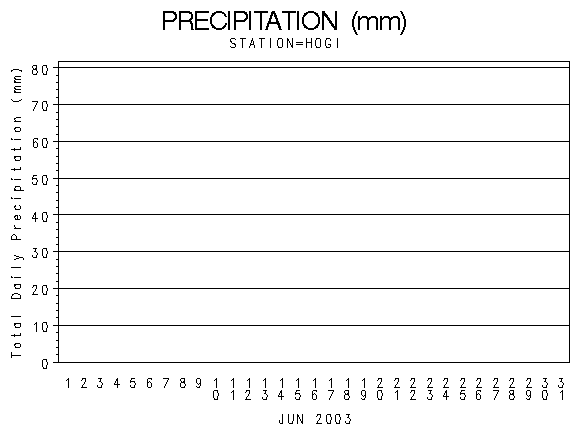 |
| Daily Total Precipitation (mm) |

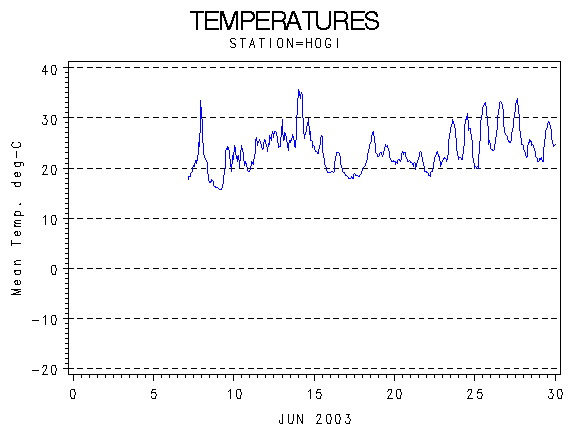 |
| Hourly Mean Temperatures (deg. C) |

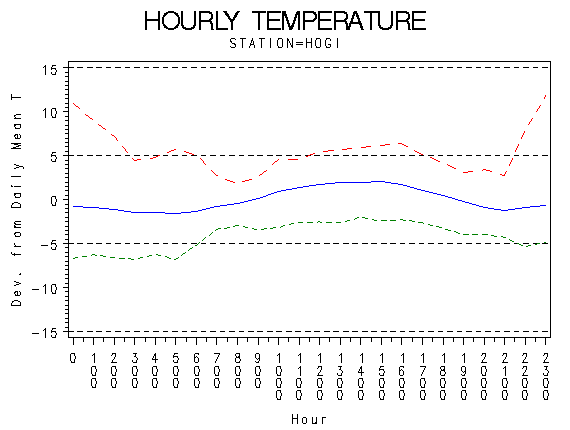 |
| Hourly Max Min and Mean Temperatures (deg. C) |

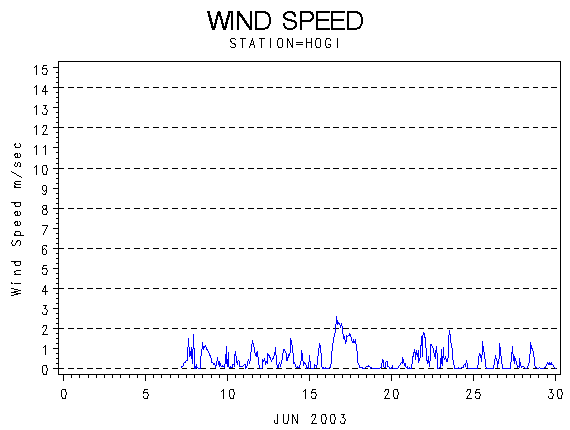 |
| Wind Speed (m/s) |

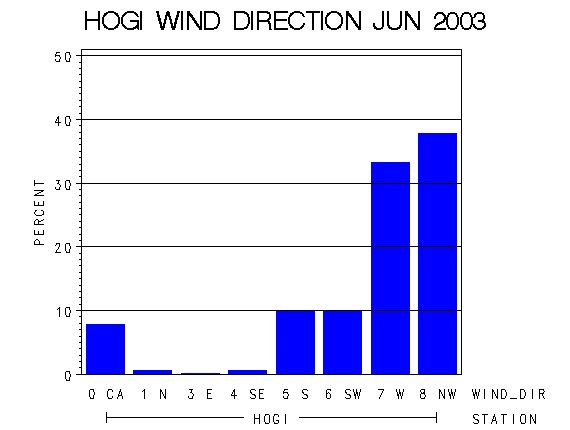 |
| Frequency of Wind Direction |

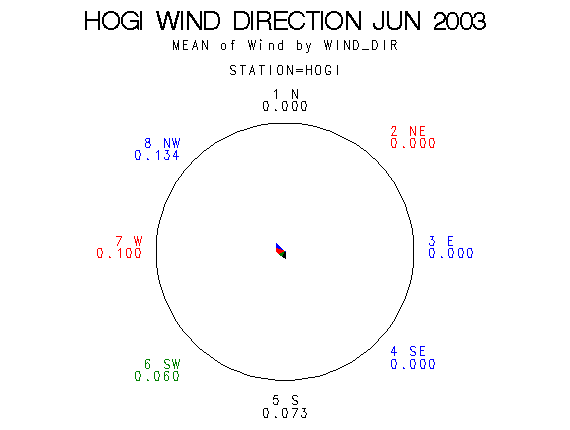 |
| Wind Vectors (circle=1.5 m/s) |

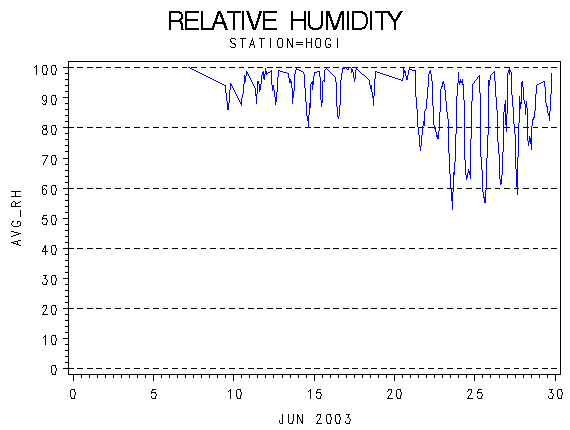 |
| Relative Humidity (percent) |

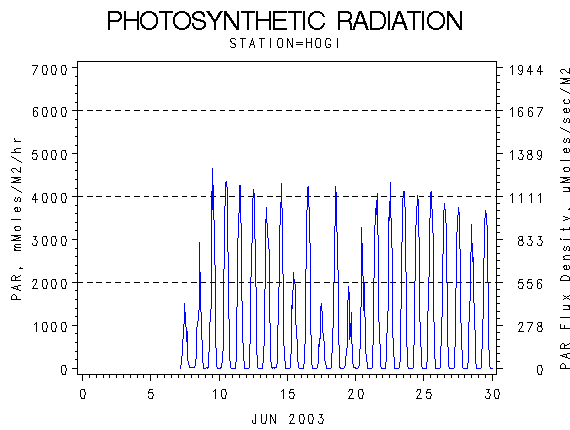 |
| Photosynthetically Active Radiation (milli-moles per m squared) |

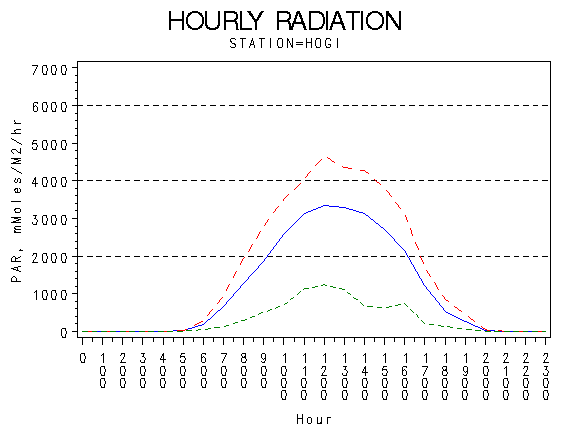 |
| Hourly Photosynthetically Active Radiation (milliMoles per m squared) |

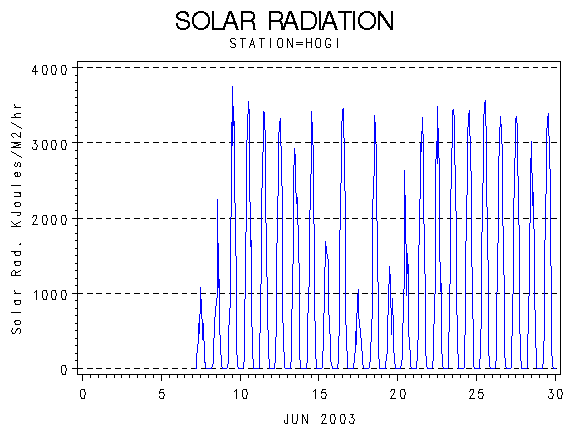 |
| Solar Radiation (KiloJoules per Meter Squared) |

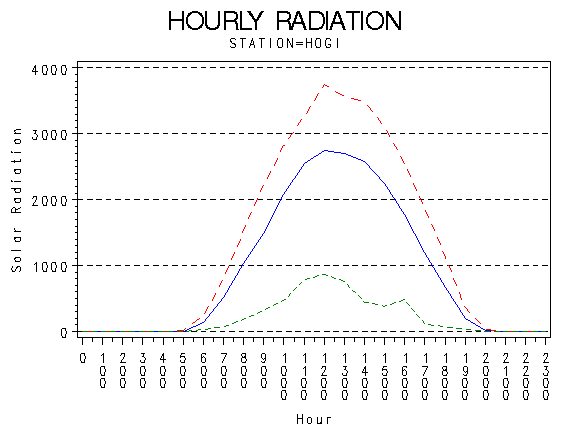 |
| Hourly Solar Radiation (KiloJoules per Meter Squared) |

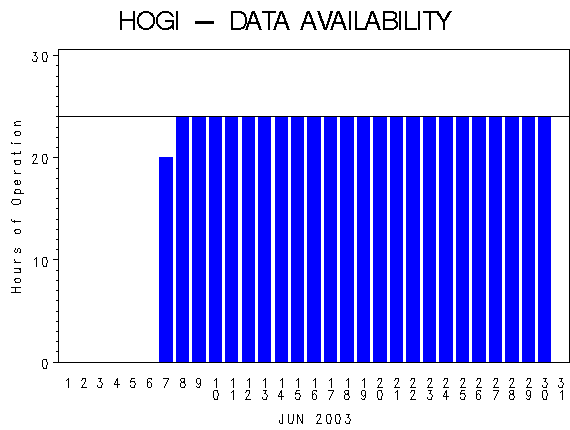 |
| Hours of Station Operation |

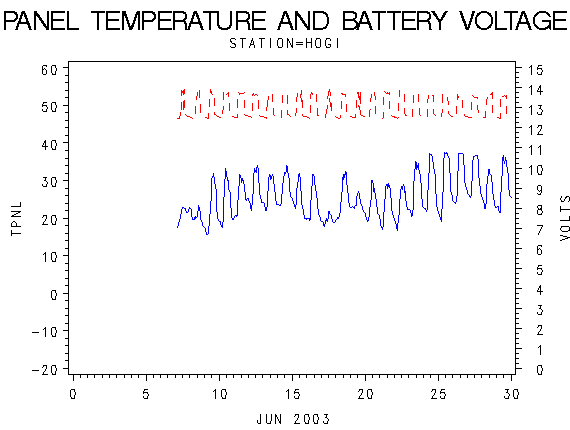 |
| Data Logger Battery Voltage and Internal Logger Temperature |
