
|
| VIRGINIA COAST RESERVE LONG-TERM ECOLOGICAL RESEARCH |
Site HOGI, Month MAY, Year 1998 |

| 
|
| Day of Month | Precip (mm) | Max Temp. oC | Min Temp. oC | Mean Temp. oC | Wind Speed (m/s) | Wind Dir (deg.) | Vapor Press. (mb) | Solar Rad. KJ/m2 | PAR uE/m2 |
|---|---|---|---|---|---|---|---|---|---|
| 1 | 19.81 | 17 | 14 | 15.3 | 1.16 | 253 | 17.02 | 4635 | 8965 |
| 2 | 0.00 | 24 | 13 | 17.9 | 0.86 | 288 | 17.26 | 27404 | 43205 |
| 3 | 0.00 | 24 | 14 | 18.6 | 1.09 | 282 | 17.33 | 27272 | 42729 |
| 4 | 14.73 | 20 | 14 | 16.9 | 1.07 | 270 | 18.07 | 15569 | 25964 |
| 5 | 1.27 | 21 | 15 | 16.9 | 1.81 | 268 | 17.74 | 19636 | 32793 |
| 6 | 0.00 | 24 | 14 | 17.8 | 0.48 | 247 | 18.71 | 26313 | 41307 |
| 7 | 0.00 | 30 | 14 | 21.9 | 1.03 | 266 | 24.11 | 18094 | 29546 |
| 8 | 27.43 | 29 | 14 | 20.1 | 1.53 | 250 | 23.51 | 7660 | 13911 |
| 9 | 0.51 | 19 | 15 | 16.3 | 2.26 | 317 | 17.47 | 6185 | 11581 |
| 10 | 0.00 | 19 | 13 | 15.5 | 1.70 | 289 | 16.42 | 8071 | 14609 |
| 11 | 0.51 | 14 | 11 | 11.9 | 1.79 | 17 | 13.15 | 5336 | 9930 |
| 12 | 24.39 | 12 | 10 | 11.1 | 2.11 | 14 | 12.81 | 5463 | 10678 |
| 13 | 0.76 | 14 | 10 | 11.0 | 2.75 | 105 | 12.00 | 15455 | 26240 |
| 14 | 0.00 | 15 | 9 | 11.1 | 1.79 | 190 | 11.88 | 22574 | 35732 |
| 15 | 0.00 | 20 | 7 | 14.6 | 0.55 | 262 | 13.45 | 29119 | 41997 |
| 16 | 0.00 | 30 | 14 | 20.4 | 0.58 | 287 | 18.00 | 27218 | 41312 |
| 17 | 0.00 | 28 | 15 | 21.0 | 0.55 | 262 | 20.11 | 21307 | 33375 |
| 18 | 0.00 | 29 | 14 | 21.5 | 0.37 | 239 | 17.71 | 29263 | 45031 |
| 19 | 0.00 | 32 | 19 | 25.0 | 0.32 | 311 | 20.45 | 29329 | 45191 |
| 20 | 0.00 | 29 | 20 | 24.2 | 0.05 | 310 | 23.35 | 18489 | 29910 |
| 21 | 0.00 | 30 | 20 | 23.6 | 0.28 | 292 | 23.57 | 17178 | 28623 |
| 22 | 0.00 | 23 | 14 | 19.3 | 0.58 | 317 | 13.47 | 29327 | 46493 |
| 23 | 4.57 | 17 | 11 | 14.7 | 0.87 | 201 | 15.56 | 6748 | 13413 |
| 24 | 0.00 | 22 | 11 | 17.3 | 0.20 | 288 | 17.16 | 11928 | 21006 |
| 25 | 1.02 | 28 | 16 | 20.6 | 1.01 | 282 | 21.67 | 26698 | 43158 |
| 26 | 0.00 | 28 | 19 | 23.3 | 0.38 | 305 | 22.05 | 25008 | 40257 |
| 27 | 78.73 | 21 | 16 | 18.1 | 0.68 | 219 | 20.11 | 8338 | 15122 |
| 28 | 3.56 | 23 | 17 | 18.6 | 0.52 | 252 | 20.10 | 23666 | 38226 |
| 29 | 0.00 | 25 | 16 | 20.6 | 0.83 | 284 | 22.08 | 25289 | 41016 |
| 30 | 0.00 | 31 | 20 | 24.4 | 0.62 | 285 | 26.52 | 27010 | 42736 |
| 31 | 0.00 | 27 | 21 | 23.0 | 1.38 | 283 | 25.45 | 25518 | 41772 |
| Mon. Tot. Precip. 177.3 mm | Mean wind vel. 1.008 m/s |
| Mon. Mean Temp. 18.5 deg. C | Wind dir 283 deg |
| Mean Max. Temp. 23.4 deg. C | Mean Min. Temp. 14.5 deg. C |
| Extreme Max. Temp 31.6 deg. C | Mean vapor press 18.65 mb |
| Extreme Min. Temp 7.2 deg. C | Total Solar Rad 591101 KJ/sq. m |
| Total photosyn. 955829 uEin/sq.m |
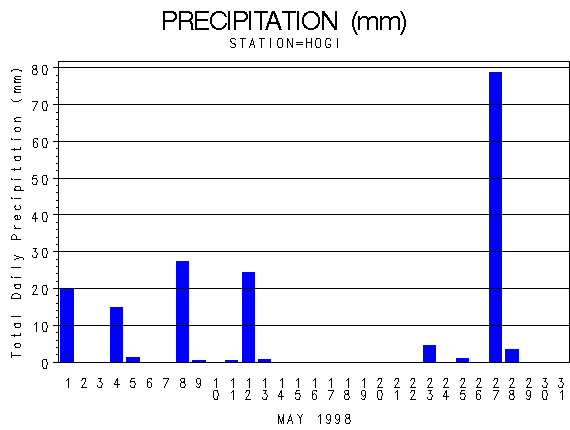 |
| Daily Total Precipitation (mm) |

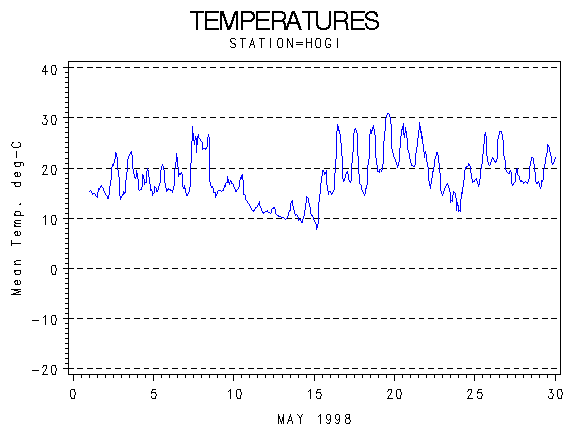 |
| Hourly Mean Temperatures (deg. C) |
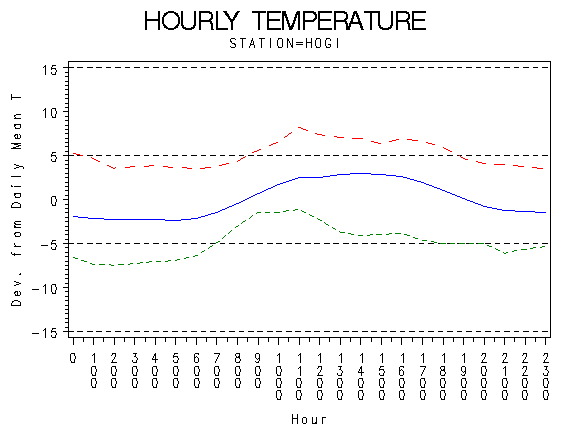 |
| Hourly Max Min and Mean Temperatures (deg. C) |
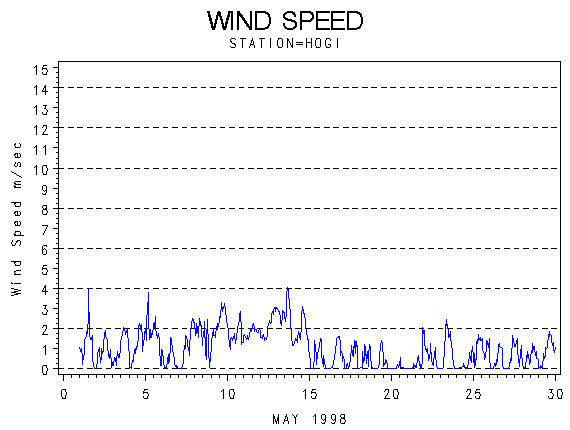 |
| Wind Speed (m/s) |
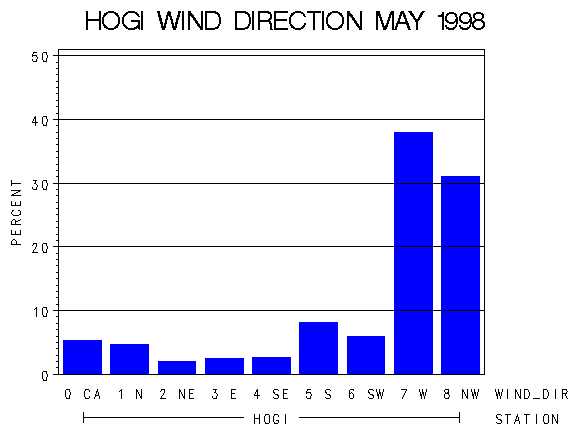 |
| Frequency of Wind Direction |
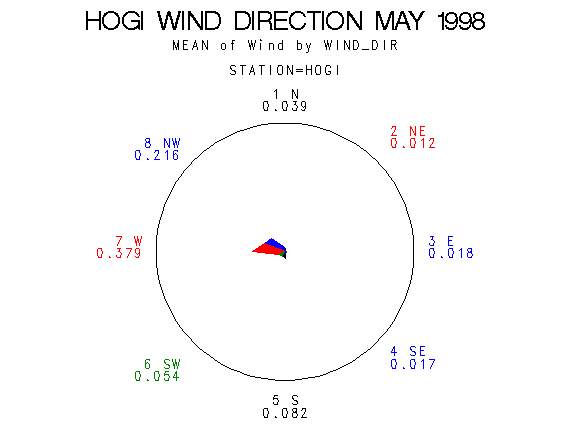 |
| Wind Vectors (circle=1.5 m/s) |
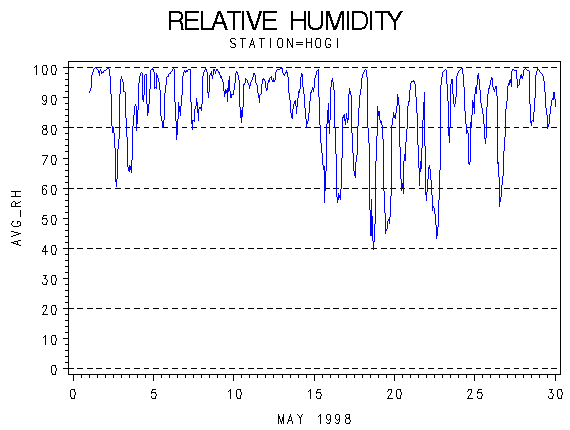 |
| Relative Humidity (percent) |
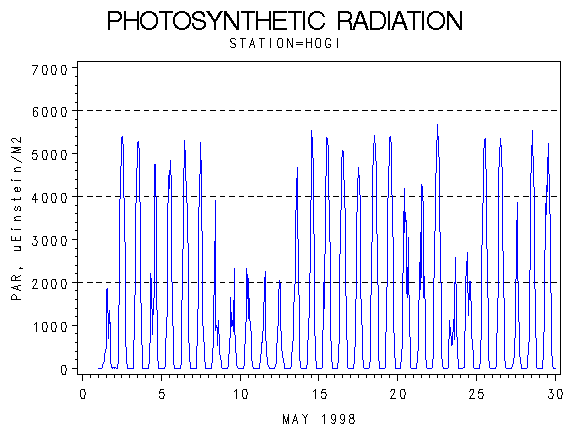 |
| Photosynthetically Active Radiation (micro-einsteins per m squared) |
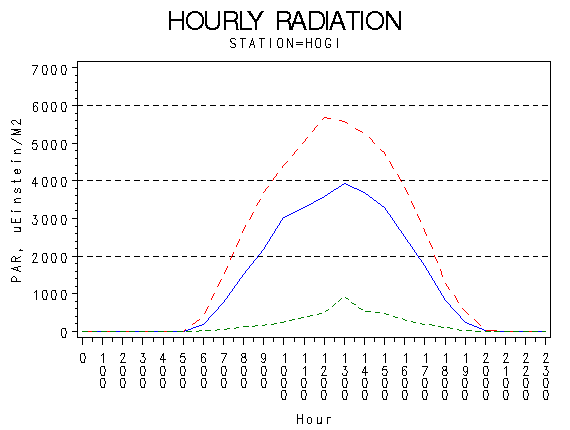 |
| Hourly Photosynthetically Active Radiation (micro-einsteins per m squared) |
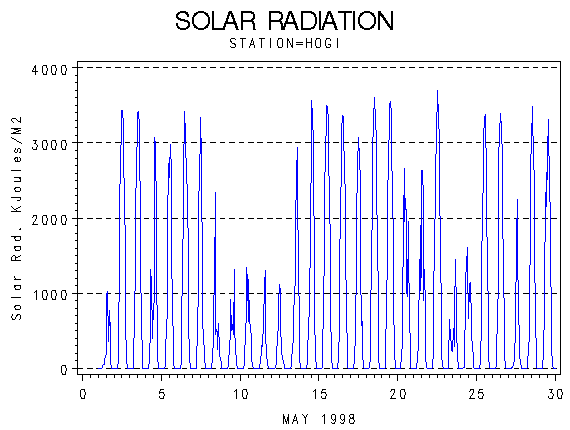 |
| Solar Radiation (KiloJoules per Meter Squared) |
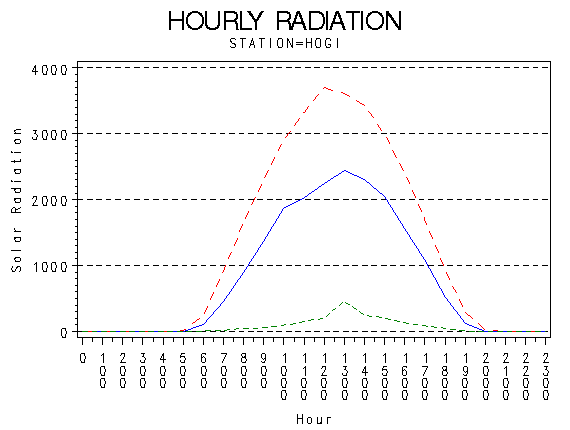 |
| Hourly Solar Radiation (KiloJoules per Meter Squared) |
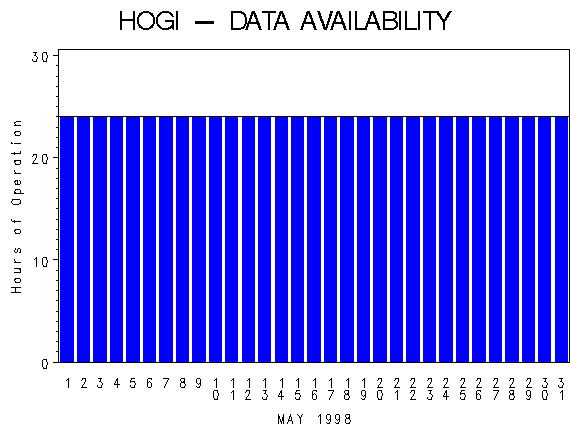 |
| Hours of Station Operation |
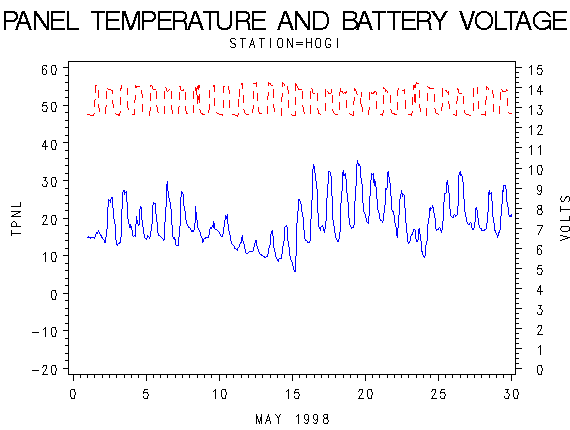 |
| Data Logger Battery Voltage and Internal Logger Temperature |