
|
| VIRGINIA COAST RESERVE LONG-TERM ECOLOGICAL RESEARCH |
Site HOGI, Month SEP, Year 1997 |

| 
|
| Day of Month | Precip (mm) | Max Temp. oC | Min Temp. oC | Mean Temp. oC | Wind Speed (m/s) | Wind Dir (deg.) | Vapor Press. (mb) | Solar Rad. KJ/m2 | PAR uE/m2 |
|---|---|---|---|---|---|---|---|---|---|
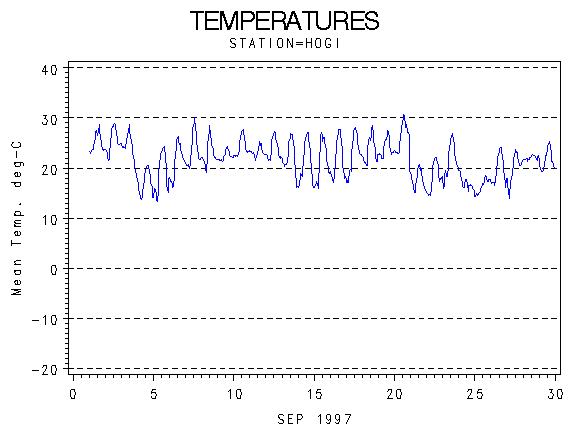
| 1 | 0.00 | 29 | 23 | 25.0 | 1.28 | 271 | 27.70 | 13664 | 24124 |
| 2 | 0.00 | 29 | 21 | 25.4 | 1.18 | 277 | 28.92 | 23181 | 38558 |
| 3 | 0.00 | 29 | 18 | 24.0 | 1.30 | 318 | 23.31 | 15054 | 26252 |
| 4 | 0.00 | 21 | 13 | 17.1 | 1.89 | 324 | 11.17 | 25192 | 41546 |
| 5 | 0.00 | 25 | 13 | 18.9 | 0.74 | 312 | 13.06 | 24471 | 40177 |
| 6 | 0.00 | 28 | 16 | 21.4 | 1.00 | 279 | 19.31 | 20384 | 34171 |
| 7 | 0.00 | 31 | 20 | 23.5 | 0.84 | 281 | 20.65 | 22952 | 37233 |
| 8 | 0.00 | 29 | 19 | 23.1 | 1.33 | 192 | 24.93 | 18453 | 30945 |
| 9 | 3.05 | 25 | 21 | 22.4 | 2.35 | 181 | 25.31 | 12282 | 21332 |
| 10 | 0.00 | 28 | 22 | 24.2 | 1.63 | 267 | 27.18 | 19799 | 33843 |
| 11 | 1.27 | 26 | 21 | 23.2 | 1.91 | 278 | 25.80 | 10557 | 19305 |
| 12 | 0.00 | 28 | 21 | 23.7 | 0.82 | 278 | 26.39 | 19466 | 32588 |
| 13 | 0.00 | 28 | 16 | 22.2 | 0.55 | 272 | 21.42 | 20208 | 32877 |
| 14 | 0.00 | 28 | 16 | 21.3 | 0.58 | 318 | 18.87 | 19107 | 31228 |
| 15 | 0.00 | 28 | 16 | 21.2 | 0.54 | 282 | 20.26 | 16078 | 26670 |
| 16 | 0.00 | 28 | 17 | 21.8 | 0.58 | 247 | 21.06 | 19915 | 32134 |
| 17 | 0.00 | 29 | 16 | 22.8 | 0.93 | 277 | 22.39 | 20476 | 32718 |
| 18 | 0.00 | 29 | 20 | 23.6 | 0.62 | 280 | 24.91 | 11445 | 19734 |
| 19 | 0.00 | 28 | 22 | 23.9 | 1.13 | 244 | 26.16 | 19014 | 30814 |
| 20 | 0.00 | 32 | 19 | 26.0 | 1.03 | 300 | 27.47 | 19434 | 31592 |
| 21 | 0.00 | 21 | 15 | 17.7 | 1.78 | 324 | 12.53 | 21667 | 35113 |
| 22 | 0.00 | 23 | 14 | 18.2 | 1.04 | 239 | 14.28 | 21661 | 35249 |
| 23 | 0.00 | 27 | 16 | 21.6 | 0.62 | 312 | 19.43 | 17548 | 29382 |
| 24 | 0.25 | 20 | 15 | 17.0 | 1.58 | 268 | 14.06 | 5320 | 10763 |
| 25 | 3.81 | 19 | 14 | 16.4 | 0.76 | 319 | 18.11 | 4639 | 8957 |
| 26 | 0.00 | 24 | 15 | 19.6 | 1.04 | 312 | 17.30 | 20316 | 32893 |
| 27 | 0.00 | 24 | 14 | 19.9 | 2.15 | 183 | 17.72 | 17647 | 28832 |
| 28 | 10.92 | 23 | 21 | 22.0 | 2.28 | 207 | 24.91 | 3701 | 7624 |
| 29 | 0.25 | 26 | 19 | 21.7 | 1.13 | 304 | 18.43 | 19020 | 30221 |
| 30 | 0.00 | 28 | 17 | 22.0 | 0.99 | 302 | 16.54 | 19710 | 31012 |
| Mon. Tot. Precip. 19.6 mm | Mean wind vel. 1.187 m/s |
| Mon. Mean Temp. 21.7 deg. C | Wind dir 272 deg |
| Mean Max. Temp. 26.4 deg. C | Mean Min. Temp. 17.6 deg. C |
| Extreme Max. Temp 31.6 deg. C | Mean vapor press 20.99 mb |
| Extreme Min. Temp 12.8 deg. C | Total Solar Rad 522361 KJ/sq. m |
| Total photosyn. 867888 uEin/sq.m |
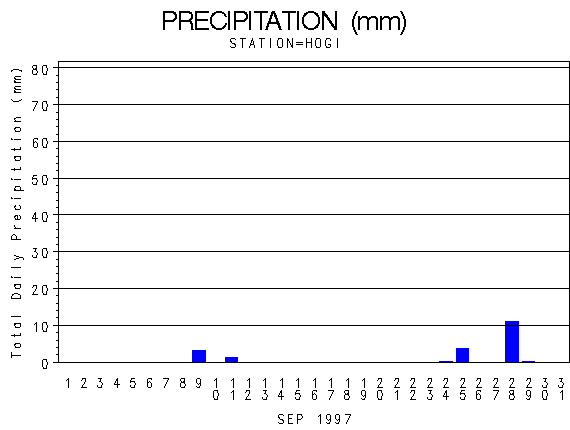 |
| Daily Total Precipitation (mm) |

 |
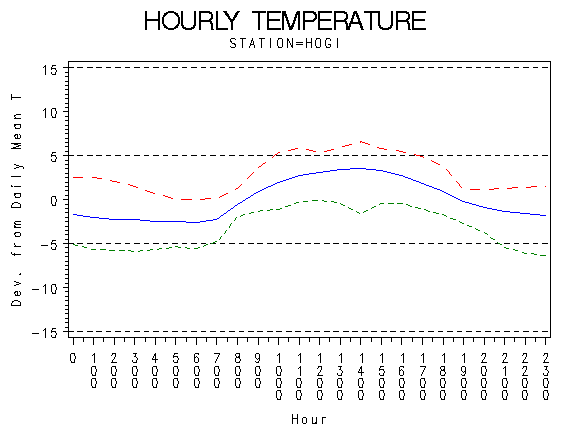
| Hourly Mean Temperatures (deg. C) |
 |
| Hourly Max Min and Mean Temperatures (deg. C) |
 |
| Wind Speed (m/s) |
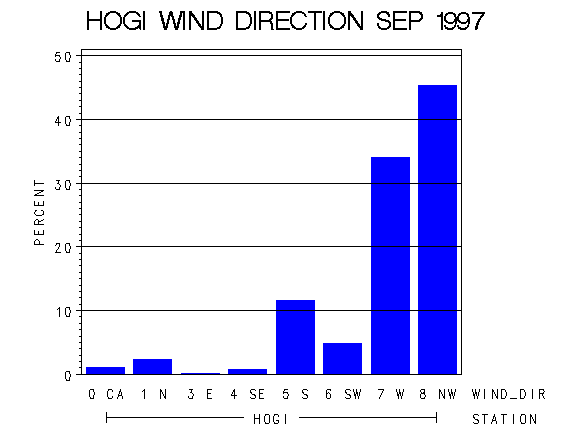 |
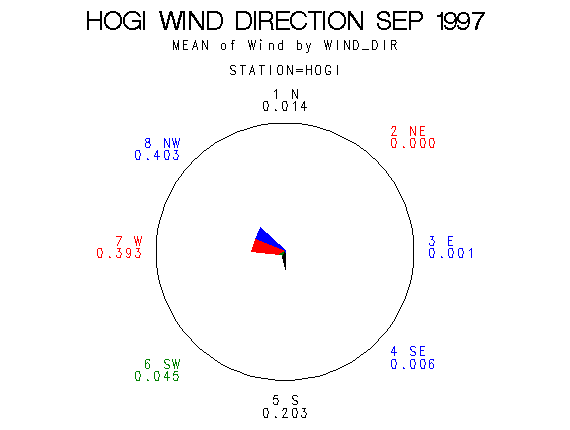
| Frequency of Wind Direction |
 |
| Wind Vectors (circle=1.5 m/s) |
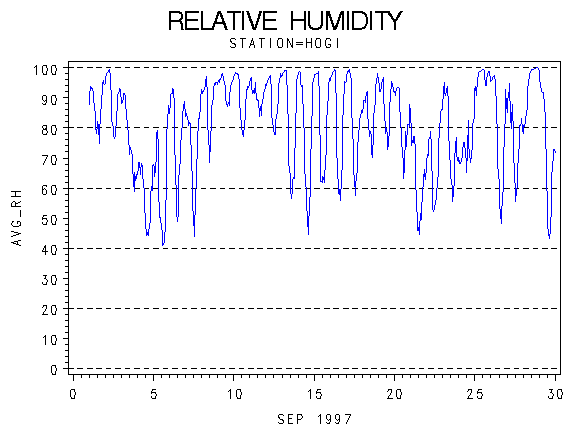 |
| Relative Humidity (percent) |
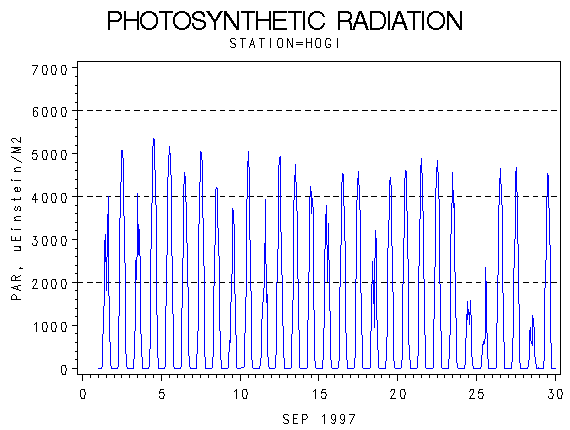 |
| Photosynthetically Active Radiation (micro-einsteins per m squared) |
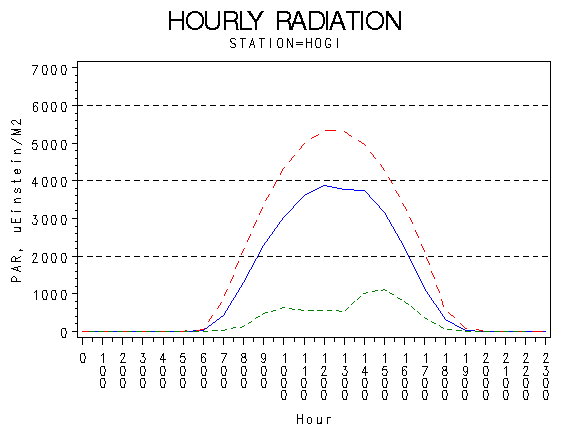 |
| Hourly Photosynthetically Active Radiation (micro-einsteins per m squared) |
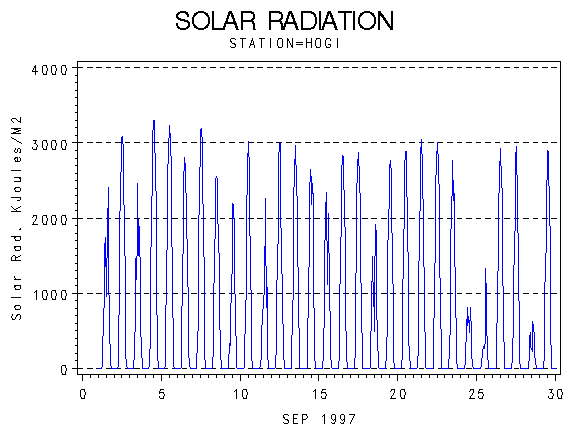 |
| Solar Radiation (KiloJoules per Meter Squared) |
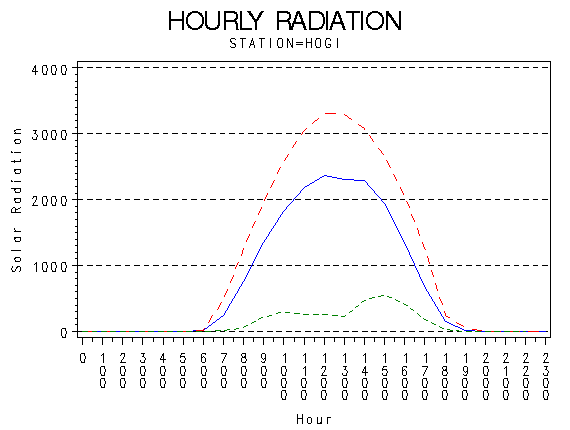 |
| Hourly Solar Radiation (KiloJoules per Meter Squared) |
 |
| Hours of Station Operation |
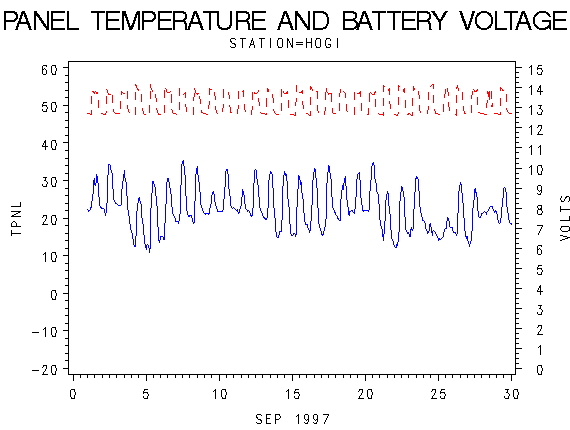 |
| Data Logger Battery Voltage and Internal Logger Temperature |