
|
| VIRGINIA COAST RESERVE LONG-TERM ECOLOGICAL RESEARCH |
Site HOGI, Month MAY, Year 1997 |

| 
|
| Day of Month | Precip (mm) | Max Temp. oC | Min Temp. oC | Mean Temp. oC | Wind Speed (m/s) | Wind Dir (deg.) | Vapor Press. (mb) | Solar Rad. KJ/m2 | PAR uE/m2 |
|---|---|---|---|---|---|---|---|---|---|
| 1 | . | 21 | 12 | 16.3 | 2.01 | 288 | 16.41 | 22811 | 35654 |
| 2 | . | 19 | 12 | 14.5 | 2.32 | 296 | 10.36 | 28849 | 43962 |
| 3 | . | 19 | 12 | 16.0 | 2.59 | 278 | 16.42 | 12095 | 20292 |
| 4 | . | 20 | 12 | 15.9 | 2.23 | 305 | 10.73 | 28411 | 43622 |
| 5 | . | 19 | 10 | 14.3 | 1.82 | 275 | 10.35 | 29394 | 44374 |
| 6 | . | 24 | 10 | 16.7 | 1.90 | 292 | 12.89 | 23503 | 36473 |
| 7 | . | 19 | 9 | 13.9 | 1.50 | 292 | 9.34 | 29803 | 45202 |
| 8 | . | 17 | 11 | 13.8 | 2.12 | 241 | 10.05 | 27106 | 42423 |
| 9 | . | 25 | 14 | 17.9 | 1.46 | 288 | 16.69 | 22417 | 35621 |
| 10 | . | 17 | 11 | 13.1 | 2.47 | 302 | 10.26 | 19393 | 30135 |
| 11 | . | 19 | 10 | 14.0 | 2.06 | 291 | 9.89 | 30041 | 45175 |
| 12 | . | 20 | 13 | 16.5 | 2.08 | 277 | 14.78 | 26792 | 40901 |
| 13 | . | 19 | 11 | 15.8 | 1.49 | 293 | 15.78 | 11370 | 19482 |
| 14 | . | 19 | 9 | 15.2 | 1.59 | 274 | 13.56 | 28265 | 43370 |
| 15 | . | 23 | 13 | 18.7 | 1.55 | 285 | 16.51 | 22241 | 35309 |
| 16 | . | 19 | 11 | 14.5 | 2.32 | 298 | 10.02 | 29764 | 45292 |
| 17 | . | 24 | 12 | 17.6 | 1.03 | 286 | 12.60 | 27055 | 41819 |
| 18 | . | 24 | 12 | 18.5 | 1.41 | 264 | 15.85 | 28727 | 44945 |
| 19 | . | 30 | 17 | 22.2 | 1.63 | 278 | 19.03 | 28530 | 44516 |
| 20 | . | 27 | 12 | 21.1 | 1.11 | 304 | 19.63 | 13670 | 24524 |
| 21 | . | 21 | 12 | 16.6 | 1.73 | 312 | 10.15 | 27256 | 44052 |
| 22 | . | 20 | 10 | 15.3 | 1.99 | 303 | 8.93 | 31004 | 49392 |
| 23 | . | 21 | 10 | 15.9 | 0.93 | 305 | 10.80 | 30386 | 48274 |
| 24 | . | 22 | 12 | 17.6 | 1.59 | 265 | 17.05 | 28518 | 46373 |
| 25 | . | 25 | 18 | 20.4 | 1.86 | 281 | 20.70 | 17083 | 30466 |
| 26 | . | 21 | 13 | 16.0 | 2.24 | 146 | 17.35 | 6744 | 12782 |
| 27 | . | 17 | 11 | 13.8 | 3.28 | 157 | 12.89 | 23337 | 38294 |
| 28 | . | 17 | 11 | 13.7 | 2.53 | 171 | 11.20 | 30979 | 48434 |
| 29 | . | 19 | 11 | 14.9 | 1.81 | 214 | 13.81 | 28773 | 46452 |
| 30 | . | 20 | 14 | 16.8 | 1.35 | 184 | 18.09 | 21746 | 36100 |
| 31 | . | 20 | 15 | 17.4 | 1.11 | 209 | 19.21 | 13191 | 22374 |
| Mon. Tot. Precip. . mm | Mean wind vel. 1.843 m/s |
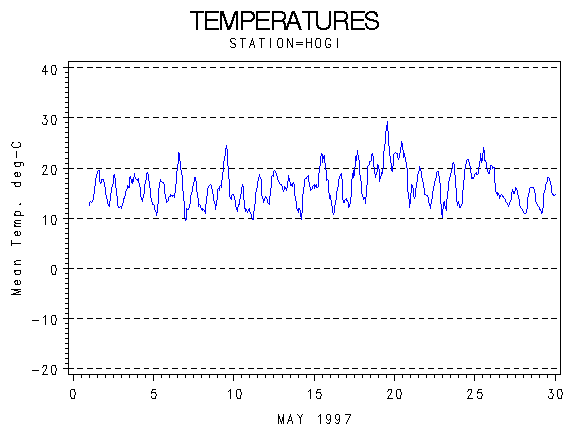
| Mon. Mean Temp. 16.3 deg. C | Wind dir 275 deg |
| Mean Max. Temp. 20.9 deg. C | Mean Min. Temp. 11.9 deg. C |
| Extreme Max. Temp 30.2 deg. C | Mean vapor press 13.91 mb |
| Extreme Min. Temp 8.5 deg. C | Total Solar Rad 749253 KJ/sq. m |
| Total photosyn. 1186084 uEin/sq.m |
 |
| Daily Total Precipitation (mm) |

 |
| Hourly Mean Temperatures (deg. C) |
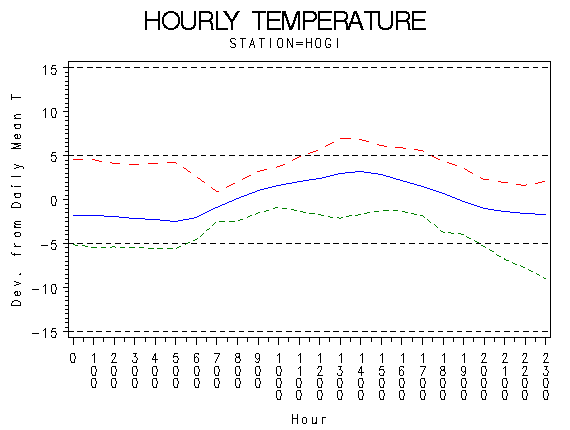 |
| Hourly Max Min and Mean Temperatures (deg. C) |
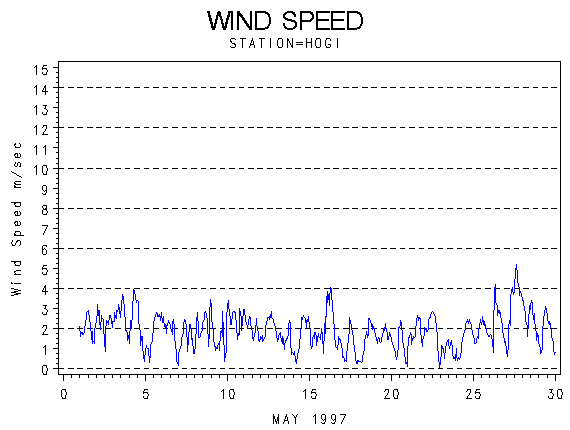 |
| Wind Speed (m/s) |
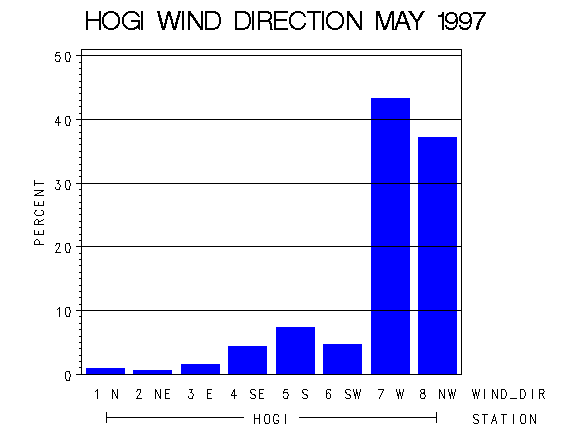 |
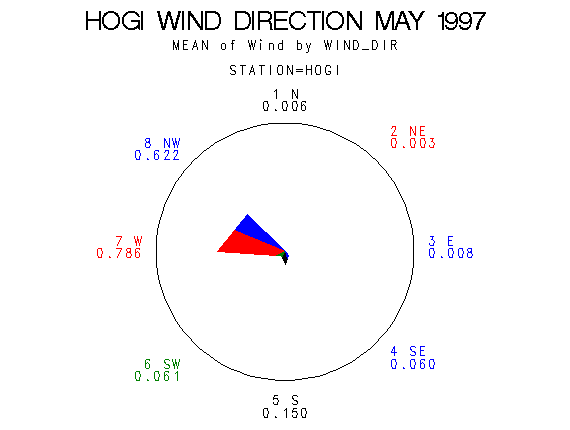
| Frequency of Wind Direction |
 |
| Wind Vectors (circle=1.5 m/s) |
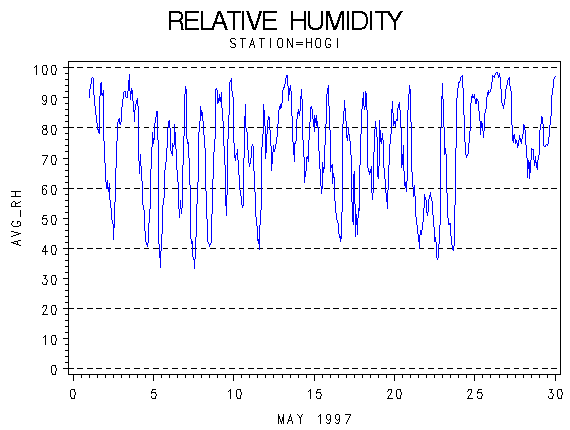 |
| Relative Humidity (percent) |
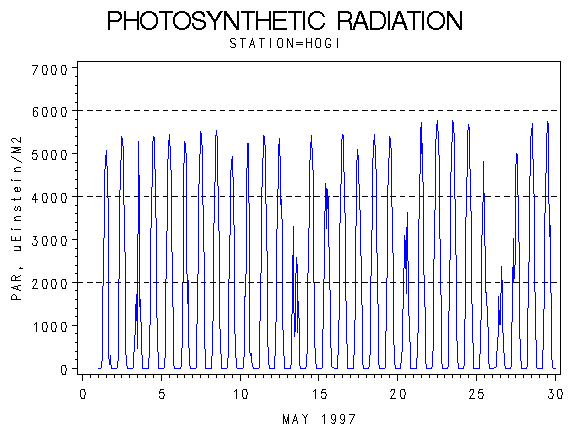 |
| Photosynthetically Active Radiation (micro-einsteins per m squared) |
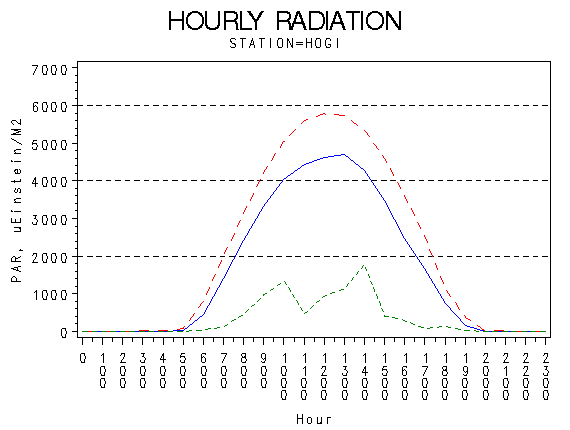 |
| Hourly Photosynthetically Active Radiation (micro-einsteins per m squared) |
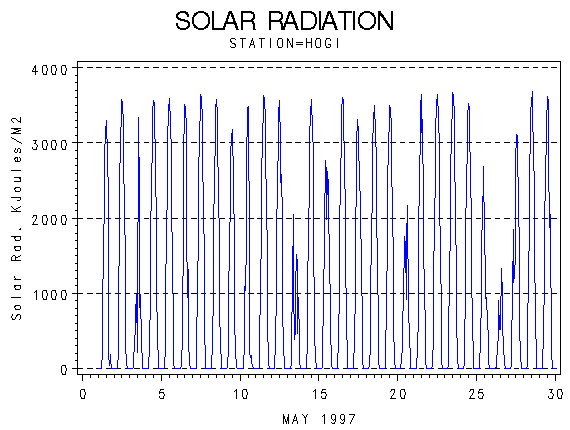 |
| Solar Radiation (KiloJoules per Meter Squared) |
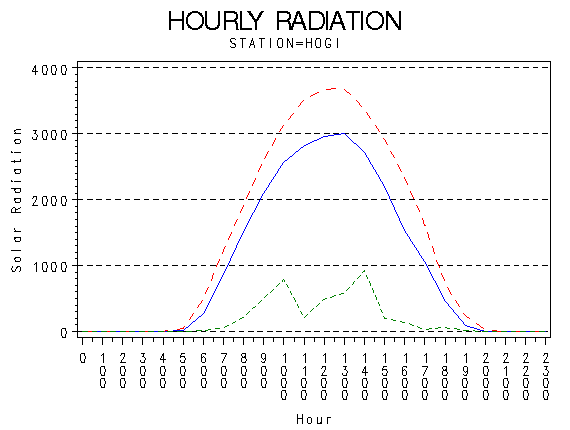 |
| Hourly Solar Radiation (KiloJoules per Meter Squared) |
 |
| Hours of Station Operation |
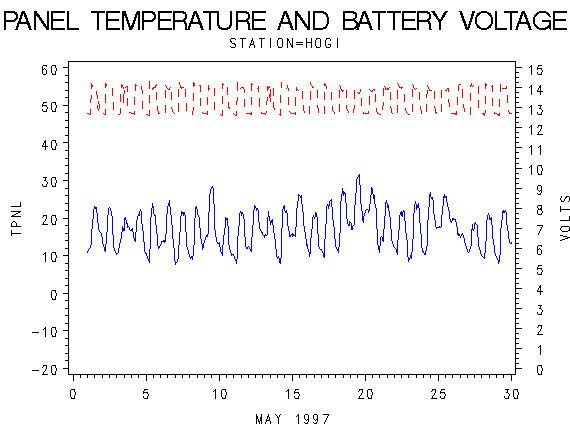 |
| Data Logger Battery Voltage and Internal Logger Temperature |