
|
| VIRGINIA COAST RESERVE LONG-TERM ECOLOGICAL RESEARCH |
Site HOGI, Month FEB, Year 1995 |

| 
|
| Day of Month | Precip (mm) | Max Temp. oC | Min Temp. oC | Mean Temp. oC | Wind Speed (m/s) | Wind Dir (deg.) | Vapor Press. (mb) | Solar Rad. KJ/m2 | PAR uE/m2 |
|---|---|---|---|---|---|---|---|---|---|
| 1 | 0.00 | 11 | 2 | 6.0 | 0.92 | 43 | 7.32 | 11453 | 21195 |
| 2 | 0.00 | 10 | 3 | 6.5 | 0.95 | 50 | 7.15 | 8876 | 16869 |
| 3 | 0.00 | 5 | -2 | 1.1 | 1.50 | 28 | 4.29 | 10593 | 19863 |
| 4 | 3.90 | 11 | 2 | 4.9 | 3.07 | 106 | 7.50 | 4049 | 7882 |
| 5 | 0.00 | 2 | -6 | -1.2 | 3.50 | 121 | 2.70 | 11488 | 21210 |
| 6 | 0.00 | -2 | -10 | -6.0 | 2.77 | 135 | 1.76 | 12990 | 23859 |
| 7 | 0.00 | 1 | -6 | -3.5 | 1.05 | 73 | 2.81 | 12977 | 23711 |
| 8 | 0.00 | -1 | -7 | -2.9 | 2.65 | 138 | 3.23 | 10663 | 19863 |
| 9 | 0.00 | 2 | -6 | -2.4 | 2.00 | 123 | 2.82 | 13572 | 24955 |
| 10 | 0.00 | 6 | -0 | 2.9 | 1.25 | 101 | 5.14 | 8109 | 16014 |
| 11 | 0.00 | 11 | 2 | 4.4 | 0.62 | 75 | 7.66 | 10010 | 19658 |
| 12 | 0.00 | 4 | -5 | -1.9 | 2.79 | 133 | 3.10 | 13922 | 25989 |
| 13 | 0.00 | 1 | -7 | -4.2 | 1.20 | 83 | 2.56 | 13267 | 24936 |
| 14 | 0.00 | 2 | -7 | -1.4 | 0.61 | 41 | 3.92 | 4797 | 10438 |
| 15 | 14.90 | 5 | -2 | 2.9 | 0.98 | 45 | 7.16 | 1619 | 3701 |
| 16 | 12.20 | 8 | 4 | 5.5 | 0.95 | 53 | 9.34 | 2814 | 5910 |
| 17 | 3.60 | 6 | 2 | 4.0 | 1.16 | 29 | 7.81 | 7917 | 14832 |
| 18 | 0.90 | 5 | 2 | 3.9 | 1.82 | 16 | 7.68 | 2366 | 5159 |
| 19 | 0.00 | 12 | 3 | 6.3 | 1.32 | 24 | 8.68 | 11066 | 21536 |
| 20 | 0.00 | 11 | 4 | 6.0 | 0.78 | 62 | 8.93 | 6343 | 12907 |
| 21 | 0.00 | 11 | 5 | 6.8 | 1.94 | 91 | 7.88 | 12580 | 23442 |
| 22 | 0.00 | 6 | 0 | 2.8 | 2.15 | 74 | 4.34 | 14989 | 27561 |
| 23 | 0.00 | 11 | 4 | 7.1 | 2.20 | 64 | 7.59 | 9936 | 19261 |
| 24 | 0.00 | 11 | 3 | 8.0 | 2.48 | 122 | 5.49 | 13244 | 24434 |
| 25 | 0.00 | 5 | -0 | 2.7 | 2.01 | 94 | 4.13 | 15076 | 28279 |
| 26 | 0.00 | 12 | 4 | 6.6 | 2.08 | 52 | 6.87 | 12707 | 24149 |
| 27 | 0.00 | 8 | 4 | 5.3 | 1.30 | 63 | 8.06 | 7828 | 16159 |
| 28 | 5.90 | 11 | 8 | 9.3 | 1.76 | 56 | 11.03 | 3238 | 7457 |
| Mon. Tot. Precip. 41.4 mm | Mean wind vel. 1.707 m/s |
| Mon. Mean Temp. 2.8 deg. C | Wind dir 86 deg |
| Mean Max. Temp. 6.5 deg. C | Mean Min. Temp. -0.3 deg. C |
| Extreme Max. Temp 12.2 deg. C | Mean vapor press 5.96 mb |
| Extreme Min. Temp -10.3 deg. C | Total Solar Rad 268486 KJ/sq. m |
| Total photosyn. 511226 uEin/sq.m |
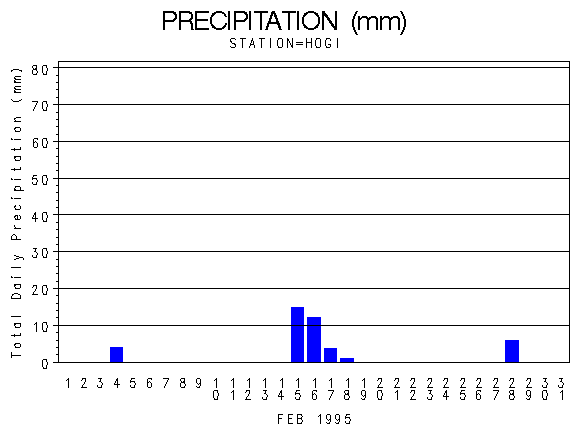 |
| Daily Total Precipitation (mm) |

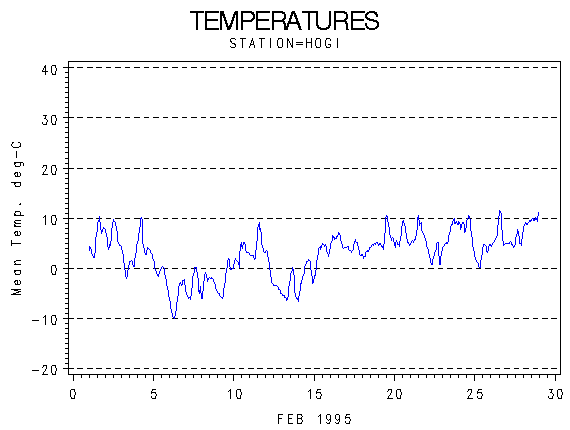 |
| Hourly Mean Temperatures (deg. C) |
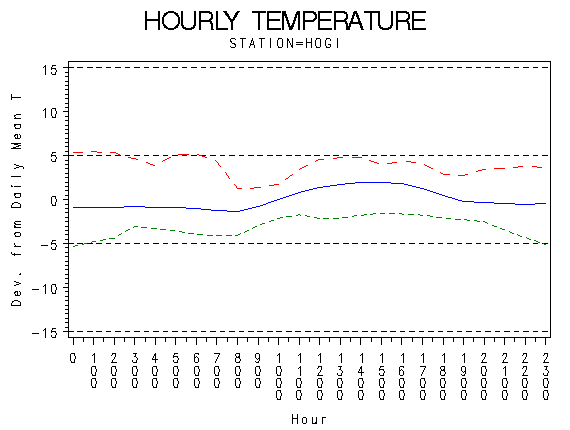 |
| Hourly Max Min and Mean Temperatures (deg. C) |
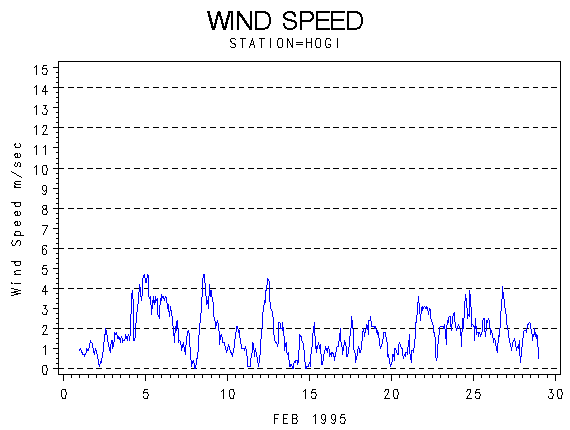 |
| Wind Speed (m/s) |
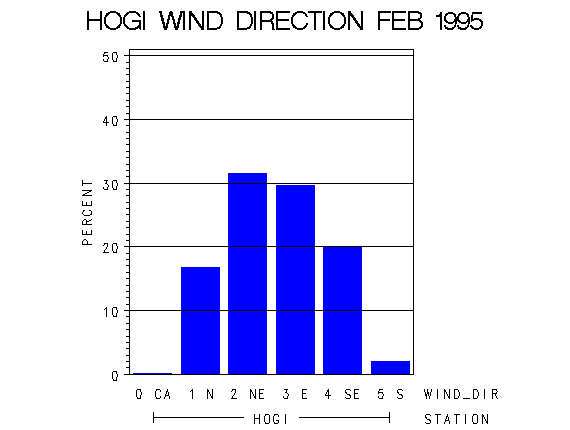 |
| Frequency of Wind Direction |
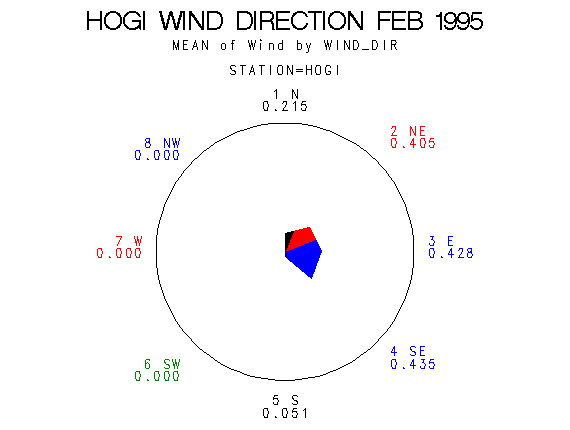 |
| Wind Vectors (circle=1.5 m/s) |
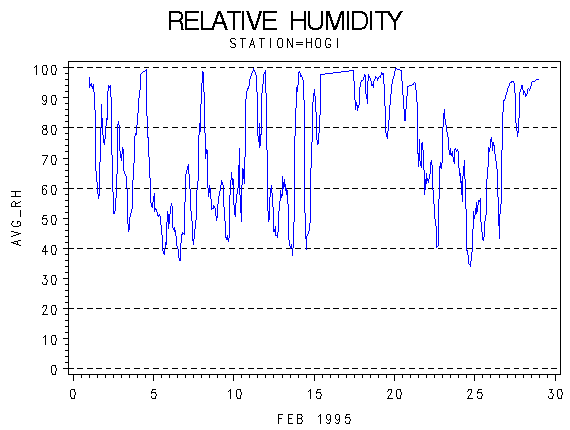 |
| Relative Humidity (percent) |
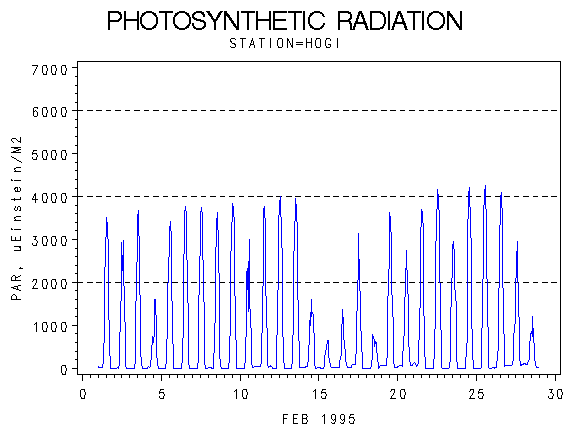 |
| Photosynthetically Active Radiation (micro-einsteins per m squared) |
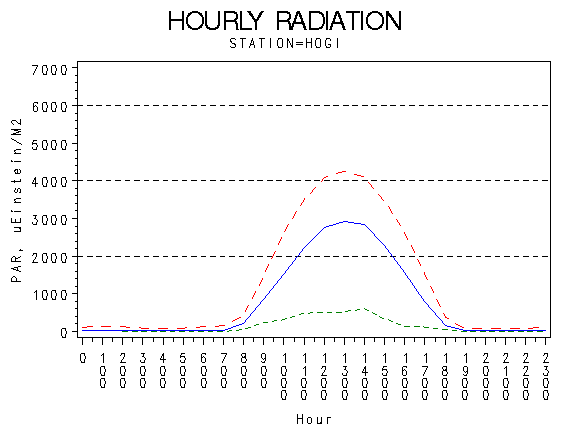 |
| Hourly Photosynthetically Active Radiation (micro-einsteins per m squared) |
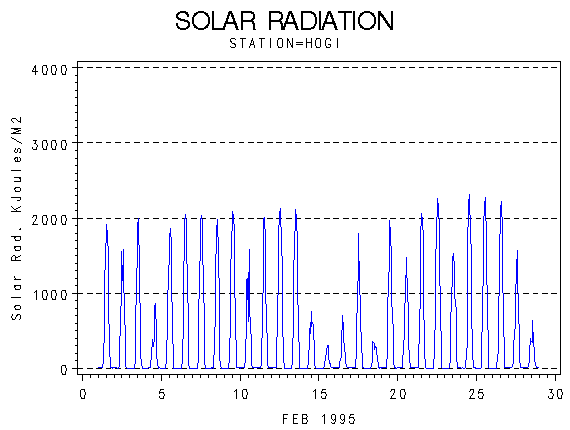 |
| Solar Radiation (KiloJoules per Meter Squared) |
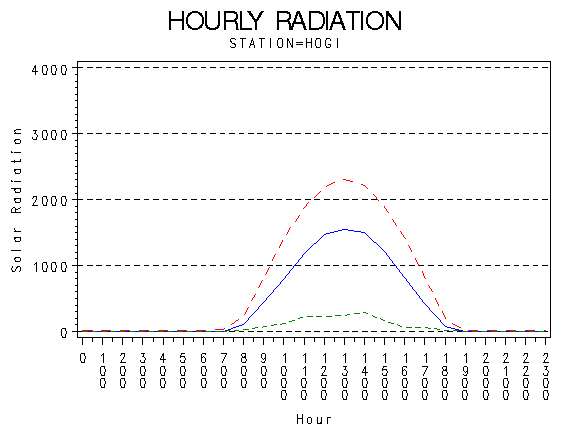 |
| Hourly Solar Radiation (KiloJoules per Meter Squared) |
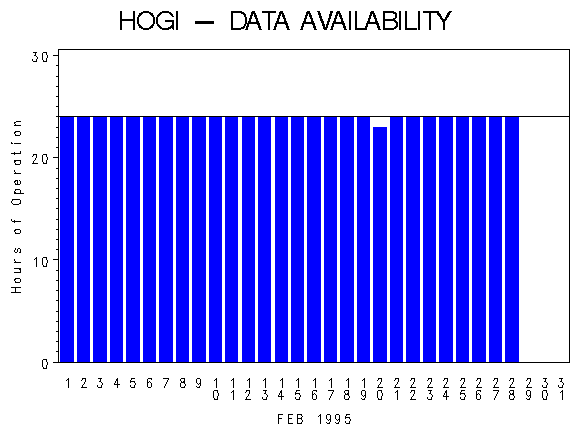 |
| Hours of Station Operation |
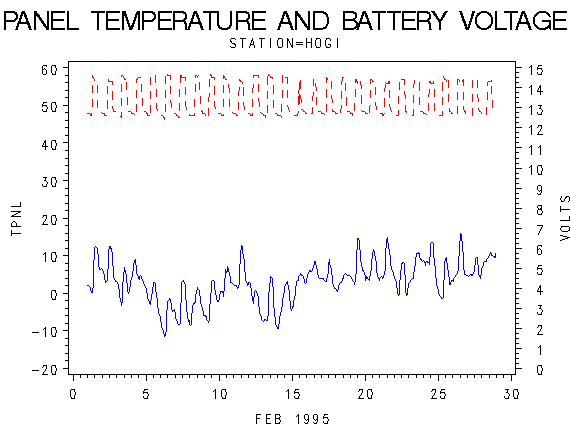 |
| Data Logger Battery Voltage and Internal Logger Temperature |