
|
| VIRGINIA COAST RESERVE LONG-TERM ECOLOGICAL RESEARCH |
Site HOGI, Month SEP, Year 1994 |

| 
|
| Day of Month | Precip (mm) | Max Temp. oC | Min Temp. oC | Mean Temp. oC | Wind Speed (m/s) | Wind Dir (deg.) | Vapor Press. (mb) | Solar Rad. KJ/m2 | PAR uE/m2 |
|---|---|---|---|---|---|---|---|---|---|
| 1 | 0.00 | 30 | 22 | 25.6 | 1.08 | 250 | 26.16 | 18547 | 37131 |
| 2 | 2.60 | 23 | 17 | 20.3 | 2.08 | 37 | 18.67 | 12014 | 24755 |
| 3 | 0.00 | 24 | 19 | 20.4 | 2.98 | 35 | 17.18 | 14385 | 29581 |
| 4 | 0.00 | 22 | 16 | 19.5 | 2.98 | 24 | 16.66 | 19652 | 39161 |
| 5 | 0.00 | 24 | 13 | 17.9 | 0.85 | 315 | 15.06 | 19973 | 38597 |
| 6 | 0.00 | 24 | 14 | 19.2 | 0.50 | 190 | 20.65 | 8494 | 17406 |
| 7 | 0.00 | 28 | 18 | 21.7 | 0.59 | 191 | 22.92 | 18152 | 34794 |
| 8 | 0.00 | 26 | 16 | 20.5 | 0.92 | 112 | 19.18 | 19659 | 37632 |
| 9 | 0.00 | 28 | 15 | 21.2 | 0.85 | 158 | 22.46 | 18464 | 35137 |
| 10 | 0.00 | 28 | 18 | 22.9 | 0.60 | 298 | 20.13 | 19335 | 36854 |
| 11 | 0.00 | 25 | 17 | 20.6 | 1.49 | 31 | 17.38 | 19607 | 38179 |
| 12 | 0.00 | 24 | 14 | 18.6 | 0.93 | 295 | 14.95 | 19351 | 37286 |
| 13 | 0.00 | 29 | 14 | 21.4 | 0.68 | 144 | 20.78 | 19059 | 35964 |
| 14 | 0.00 | 30 | 19 | 24.2 | 0.62 | 150 | 23.37 | 17681 | 33670 |
| 15 | 0.00 | 26 | 20 | 22.7 | 1.08 | 40 | 24.90 | 12367 | 25160 |
| 16 | 0.00 | 26 | 21 | 23.0 | 1.44 | 65 | 26.64 | 11884 | 23691 |
| 17 | 0.80 | 30 | 22 | 24.7 | 1.35 | 66 | 27.38 | 14720 | 29102 |
| 18 | 0.60 | 27 | 19 | 22.4 | 1.70 | 48 | 22.78 | 15101 | 30336 |
| 19 | 0.00 | 25 | 15 | 19.9 | 1.14 | 25 | 15.59 | 18973 | 36614 |
| 20 | 0.00 | 25 | 12 | 18.7 | 0.95 | 16 | 16.03 | 18320 | 35572 |
| 21 | 0.00 | 22 | 11 | 18.3 | 1.68 | 16 | 18.85 | 8771 | 18163 |
| 22 | 44.60 | 23 | 18 | 19.8 | 4.38 | 41 | 22.24 | 4090 | 8552 |
| 23 | 0.00 | 23 | 14 | 18.9 | 1.03 | 127 | 18.56 | 14146 | 28708 |
| 24 | 0.00 | 25 | 14 | 19.8 | 0.85 | 63 | 21.28 | 12832 | 27029 |
| 25 | 0.00 | 27 | 20 | 22.0 | 1.26 | 69 | 24.79 | 10845 | 22871 |
| 26 | 0.30 | 27 | 21 | 22.9 | 1.30 | 57 | 26.66 | 12972 | 26993 |
| 27 | 0.00 | 27 | 20 | 23.0 | 0.98 | 78 | 25.22 | 16502 | 32444 |
| 28 | 0.00 | 26 | 20 | 22.4 | 0.79 | 58 | 20.37 | 16441 | 31718 |
| 29 | 0.00 | 23 | 18 | 19.9 | 1.46 | 63 | 14.02 | 17533 | 33793 |
| 30 | 0.00 | 22 | 12 | 17.7 | 1.19 | 32 | 12.23 | 17563 | 33908 |
| Mon. Tot. Precip. 48.9 mm | Mean wind vel. 1.324 m/s |
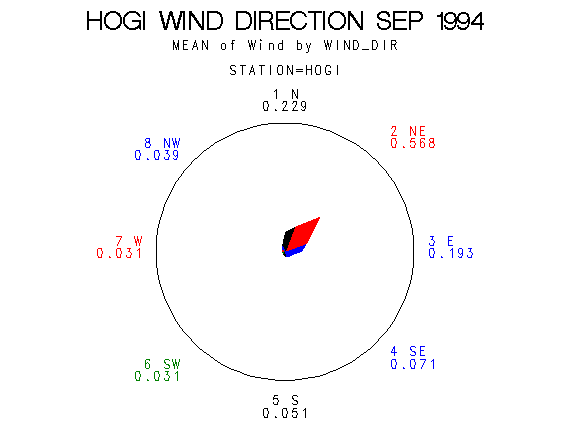
| Mon. Mean Temp. 21.0 deg. C | Wind dir 46 deg |
| Mean Max. Temp. 25.6 deg. C | Mean Min. Temp. 16.9 deg. C |
| Extreme Max. Temp 30.3 deg. C | Mean vapor press 20.44 mb |
| Extreme Min. Temp 10.9 deg. C | Total Solar Rad 467431 KJ/sq. m |
| Total photosyn. 920798 uEin/sq.m |
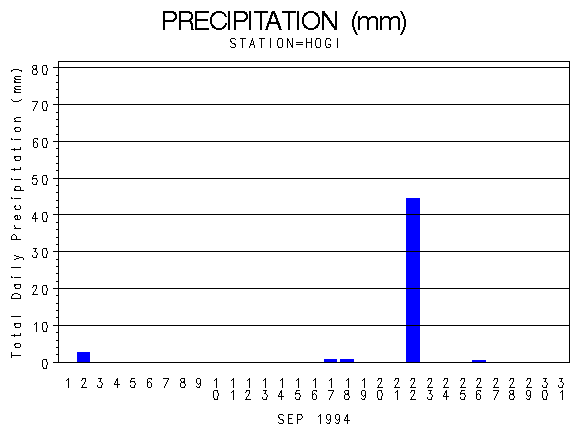 |
| Daily Total Precipitation (mm) |

 |
| Hourly Mean Temperatures (deg. C) |
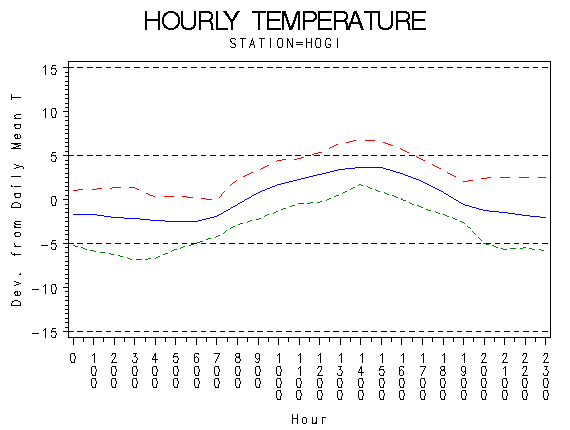 |
| Hourly Max Min and Mean Temperatures (deg. C) |
 |
| Wind Speed (m/s) |
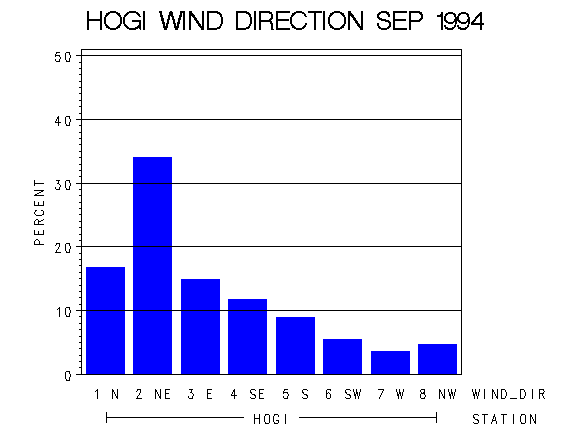 |
| Frequency of Wind Direction |
 |
| Wind Vectors (circle=1.5 m/s) |
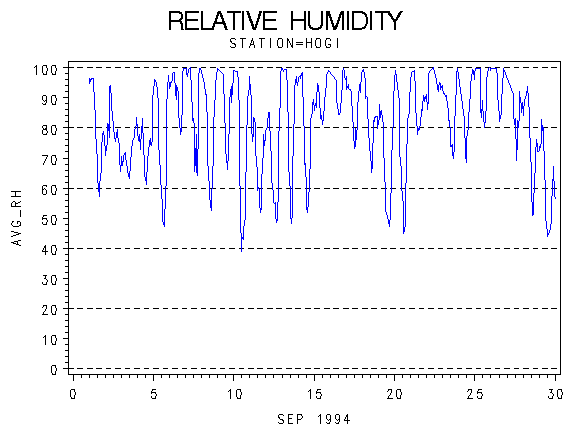 |
| Relative Humidity (percent) |
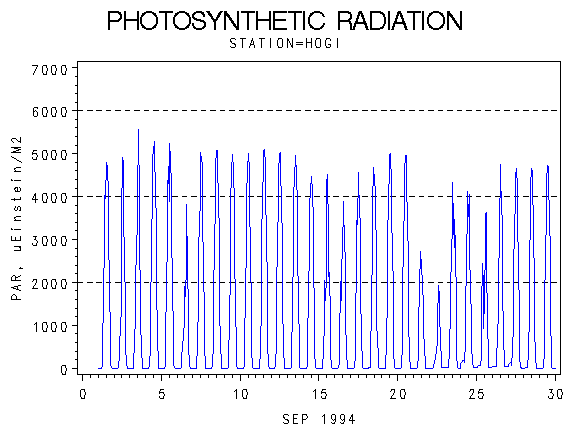 |
| Photosynthetically Active Radiation (micro-einsteins per m squared) |
 |
| Hourly Photosynthetically Active Radiation (micro-einsteins per m squared) |
 |
| Solar Radiation (KiloJoules per Meter Squared) |
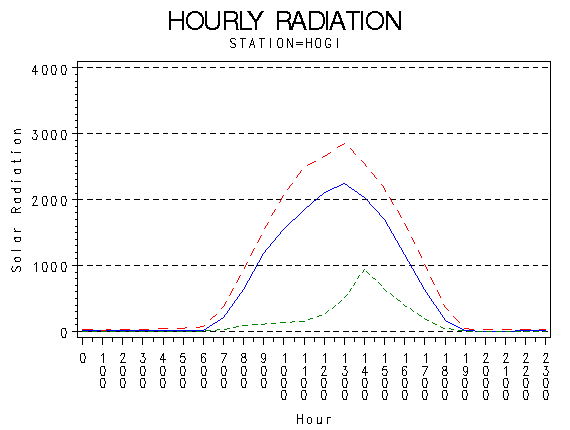 |
| Hourly Solar Radiation (KiloJoules per Meter Squared) |
 |
| Hours of Station Operation |
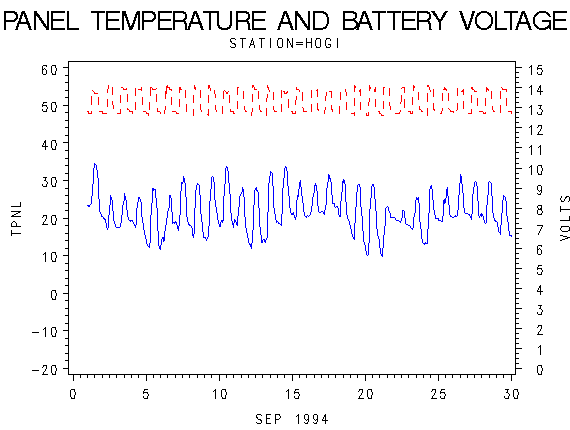 |
| Data Logger Battery Voltage and Internal Logger Temperature |