

| VIRGINIA COAST RESERVE LONG-TERM ECOLOGICAL RESEARCH |
Site HOGI, Month SEP, Year 1993 |

| 
|
| Day of Month | Precip (mm) | Max Temp. oC | Min Temp. oC | Mean Temp. oC | Wind Speed (m/s) | Wind Dir (deg.) | Vapor Press. (mb) | Solar Rad. KJ/m2 | PAR uE/m2 |
|---|---|---|---|---|---|---|---|---|---|
| 1 | 0.60 | 34 | 23 | 27.6 | 1.67 | 323 | 29.41 | 19710 | 38489 |
| 2 | 0.30 | 30 | 23 | 26.6 | 1.37 | 182 | 30.66 | 19139 | 37547 |
| 3 | 0.00 | 33 | 26 | 28.1 | 1.63 | 199 | 31.13 | 22716 | 43097 |
| 4 | 21.90 | 33 | 21 | 26.5 | 1.24 | 230 | 28.46 | 17035 | 33230 |
| 5 | 2.70 | 28 | 22 | 23.6 | 1.05 | 59 | 27.33 | 13214 | 26220 |
| 6 | 0.00 | 29 | 22 | 24.5 | 0.98 | 80 | 26.44 | 20529 | 38482 |
| 7 | 0.00 | 29 | 19 | 24.0 | 0.70 | 129 | 25.50 | 18773 | 35144 |
| 8 | 0.00 | 28 | 20 | 23.6 | 0.91 | 62 | 26.56 | 10716 | 21492 |
| 9 | 0.00 | 28 | 19 | 24.0 | 1.45 | 176 | 27.02 | 20293 | 38232 |
| 10 | 0.00 | 31 | 23 | 26.5 | 1.11 | 260 | 25.39 | 16983 | 32260 |
| 11 | 0.00 | 24 | 11 | 19.3 | 1.35 | 334 | 11.48 | 23181 | 42171 |
| 12 | 0.00 | 26 | 11 | 21.2 | 1.39 | 150 | 13.37 | 22612 | 41481 |
| 13 | 0.00 | 28 | 17 | 22.9 | 1.33 | 170 | 20.87 | 21672 | 40566 |
| 14 | 0.00 | 28 | 20 | 23.7 | 1.54 | 173 | 24.04 | 21977 | 40800 |
| 15 | 0.00 | 29 | 21 | 24.3 | 1.54 | 187 | 26.10 | 21179 | 40060 |
| 16 | 18.80 | 30 | 20 | 23.6 | 1.13 | 69 | 26.70 | 12551 | 24724 |
| 17 | 0.00 | 24 | 20 | 21.5 | 1.33 | 48 | 25.68 | 6923 | 14481 |
| 18 | 11.30 | 25 | 20 | 22.3 | 0.78 | 24 | 26.79 | 7277 | 14922 |
| 19 | 0.00 | 23 | 17 | 19.6 | 1.51 | 29 | 18.03 | 19136 | 35899 |
| 20 | 0.00 | 22 | 15 | 19.0 | 1.57 | 61 | 15.53 | 19779 | 37431 |
| 21 | 8.80 | 25 | 17 | 20.4 | 0.98 | 186 | 21.57 | 7813 | 15876 |
| 22 | 3.60 | 24 | 17 | 19.9 | 0.96 | 20 | 20.79 | 16601 | 31177 |
| 23 | 0.00 | 25 | 15 | 21.2 | 1.13 | 189 | 22.69 | 13516 | 26506 |
| 24 | 1.10 | 24 | 14 | 19.4 | 1.32 | 31 | 19.06 | 15308 | 29164 |
| 25 | 0.00 | 23 | 14 | 19.6 | 1.11 | 124 | 17.54 | 6566 | 13776 |
| 26 | 0.50 | 30 | 22 | 24.4 | 1.75 | 190 | 27.80 | 17338 | 32902 |
| 27 | 8.60 | 26 | 18 | 22.7 | 1.92 | 196 | 26.35 | 11325 | 22586 |
| 28 | 0.00 | 21 | 14 | 17.7 | 0.96 | 279 | 12.34 | 20000 | 36211 |
| 29 | 0.00 | 22 | 10 | 17.2 | 0.82 | 340 | 12.53 | 19474 | 35130 |
| 30 | 3.90 | 17 | 10 | 14.1 | 1.93 | 359 | 11.43 | 11822 | 22477 |
| Mon. Tot. Precip. 82.1 mm | Mean wind vel. 1.281 m/s |
| Mon. Mean Temp. 22.3 deg. C | Wind dir 157 deg |
| Mean Max. Temp. 26.6 deg. C | Mean Min. Temp. 18.0 deg. C |
| Extreme Max. Temp 33.9 deg. C | Mean vapor press 22.62 mb |
| Extreme Min. Temp 10.2 deg. C | Total Solar Rad 495158 KJ/sq. m |
| Total photosyn. 942530 uEin/sq.m |
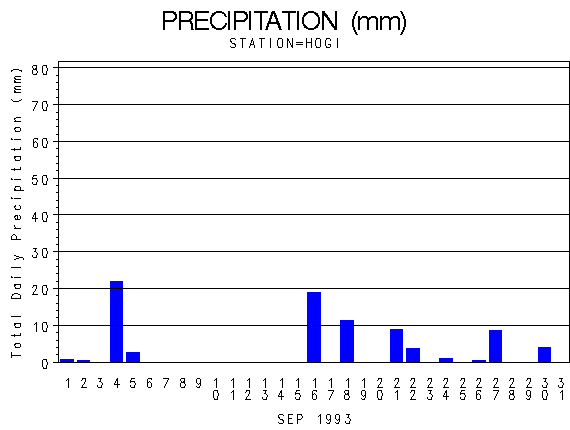 |
| Daily Total Precipitation (mm) |

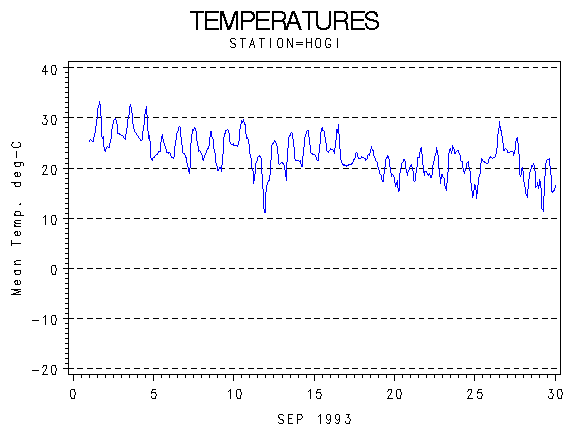 |
| Hourly Mean Temperatures (deg. C) |

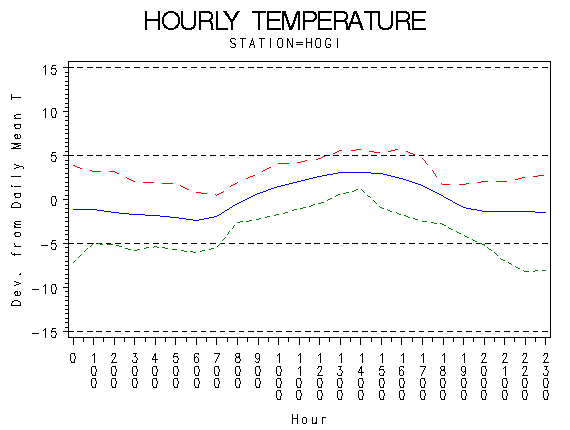 |
| Hourly Max Min and Mean Temperatures (deg. C) |

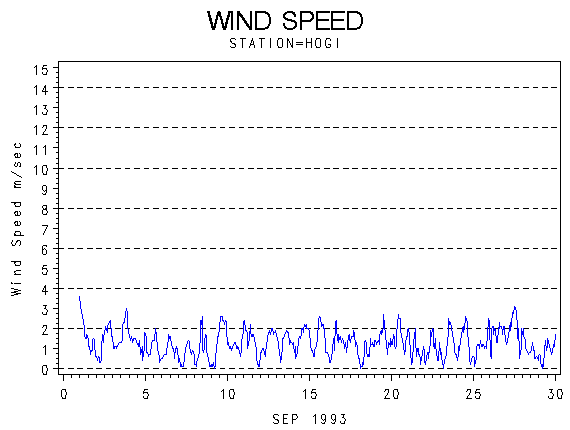 |
| Wind Speed (m/s) |

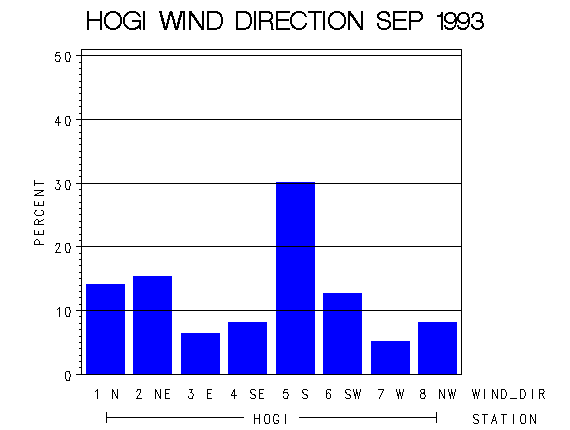 |
| Frequency of Wind Direction |

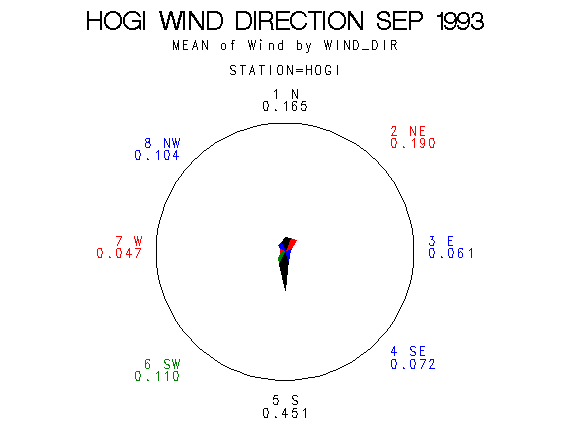 |
| Wind Vectors (circle=1.5 m/s) |

 |
| Relative Humidity (percent) |

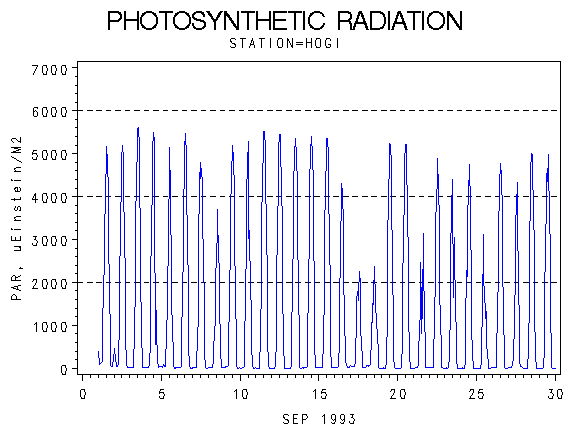 |
| Photosynthetically Active Radiation (micro-einsteins per m squared) |

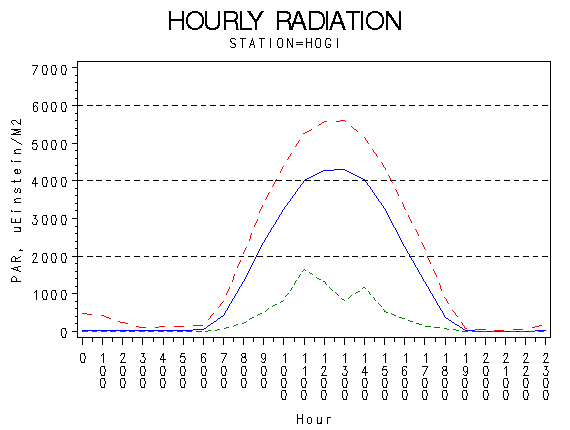 |
| Hourly Photosynthetically Active Radiation (micro-einsteins per m squared) |

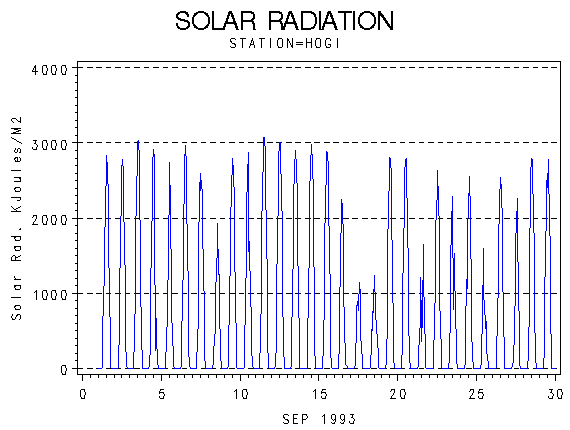 |
| Solar Radiation (KiloJoules per Meter Squared) |

 |
| Hourly Solar Radiation (KiloJoules per Meter Squared) |

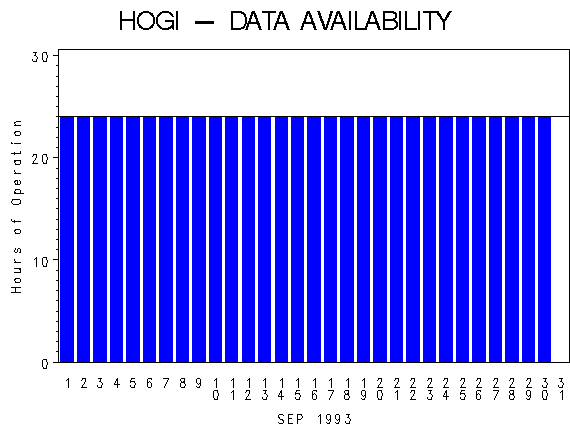 |
| Hours of Station Operation |

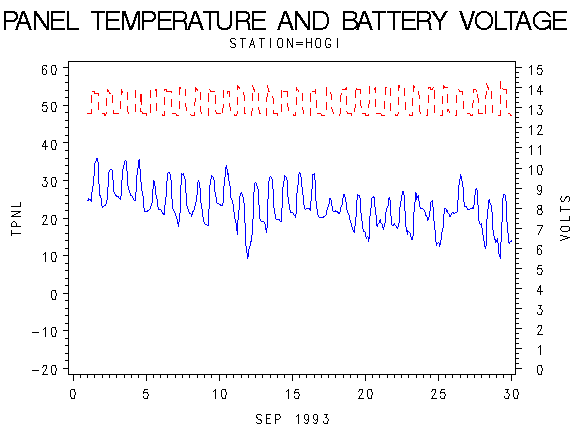 |
| Data Logger Battery Voltage and Internal Logger Temperature |
