

| VIRGINIA COAST RESERVE LONG-TERM ECOLOGICAL RESEARCH |
Site HOGI, Month SEP, Year 1992 |

| 
|
| Day of Month | Precip (mm) | Max Temp. oC | Min Temp. oC | Mean Temp. oC | Wind Speed (m/s) | Wind Dir (deg.) | Vapor Press. (mb) | Solar Rad. KJ/m2 | PAR uE/m2 |
|---|---|---|---|---|---|---|---|---|---|
| 1 | 0.00 | 26 | 19 | 22.6 | 1.38 | 50 | 18.74 | 22378 | 43121 |
| 2 | 0.00 | 27 | 20 | 23.6 | 2.05 | 172 | 21.11 | 19530 | 38233 |
| 3 | 0.00 | 28 | 24 | 25.1 | 2.81 | 187 | 26.98 | 19539 | 38881 |
| 4 | 1.30 | 30 | 22 | 24.9 | 0.88 | 205 | 27.52 | 17716 | 35526 |
| 5 | 0.30 | 28 | 20 | 23.7 | 1.32 | 98 | 27.30 | 14012 | 28827 |
| 6 | 68.50 | 24 | 20 | 22.5 | 1.81 | 104 | 26.00 | 5424 | 11930 |
| 7 | 0.00 | 26 | 21 | 23.3 | 0.96 | 40 | 26.53 | 15640 | 32014 |
| 8 | 0.00 | 29 | 20 | 24.2 | 0.86 | 157 | 26.70 | 21928 | 43256 |
| 9 | 0.00 | 29 | 23 | 25.3 | 1.35 | 170 | 28.77 | 20868 | 41558 |
| 10 | 0.00 | 29 | 24 | 25.9 | 1.94 | 173 | 28.79 | 22050 | 43291 |
| 11 | 0.80 | 26 | 20 | 23.0 | 1.87 | 359 | 22.47 | 13915 | 28514 |
| 12 | 0.00 | 23 | 16 | 19.7 | 2.19 | 26 | 14.60 | 22563 | 42749 |
| 13 | 0.00 | 23 | 17 | 20.2 | 2.34 | 58 | 15.19 | 21089 | 40518 |
| 14 | 1.50 | 24 | 18 | 20.2 | 2.09 | 53 | 16.19 | 16198 | 36023 |
| 15 | 0.00 | 25 | 17 | 20.7 | 1.86 | 35 | 21.45 | 17211 | 34562 |
| 16 | 0.00 | 26 | 19 | 22.1 | 1.05 | 60 | 23.37 | 21161 | 40414 |
| 17 | 0.00 | 29 | 20 | 23.6 | 1.30 | 192 | 25.99 | 20439 | 37474 |
| 18 | 0.00 | 29 | 23 | 25.3 | 1.73 | 202 | 27.10 | 19812 | 37701 |
| 19 | 0.00 | 27 | 21 | 23.7 | 1.73 | 341 | 25.24 | 10042 | 20821 |
| 20 | 0.00 | 24 | 21 | 22.0 | 2.93 | 66 | 19.19 | 12208 | 25353 |
| 21 | 0.00 | 28 | 21 | 24.1 | 1.68 | 98 | 26.76 | 17212 | 34436 |
| 22 | 0.00 | 29 | 23 | 25.0 | 1.55 | 177 | 29.40 | 17901 | 36233 |
| 23 | 5.30 | 24 | 16 | 19.4 | 2.96 | 9 | 17.68 | 11830 | 24007 |
| 24 | 2.40 | 19 | 14 | 16.0 | 4.91 | 29 | 14.46 | 5508 | 11162 |
| 25 | 79.20 | 21 | 17 | 19.0 | 5.35 | 31 | 21.37 | 2099 | 3740 |
| 26 | 0.30 | 22 | 16 | 18.2 | 1.00 | 211 | 18.48 | 5212 | 31106 |
| 27 | 0.00 | 26 | 20 | 22.2 | 1.17 | 178 | 25.29 | 8742 | 26774 |
| 28 | 1.60 | 23 | 19 | 21.1 | 1.89 | 41 | 23.54 | 8524 | 16939 |
| 29 | 1.60 | 20 | 15 | 17.5 | 2.50 | 352 | 14.46 | 17296 | 32126 |
| 30 | 0.00 | 16 | 10 | 13.3 | 2.44 | 1 | 9.13 | 2943 | 36822 |
| Mon. Tot. Precip. 162.8 mm | Mean wind vel. 1.997 m/s |
| Mon. Mean Temp. 21.9 deg. C | Wind dir 61 deg |
| Mean Max. Temp. 25.4 deg. C | Mean Min. Temp. 19.1 deg. C |
| Extreme Max. Temp 29.5 deg. C | Mean vapor press 22.33 mb |
| Extreme Min. Temp 9.6 deg. C | Total Solar Rad 450987 KJ/sq. m |
| Total photosyn. 954111 uEin/sq.m |
 |
| Daily Total Precipitation (mm) |

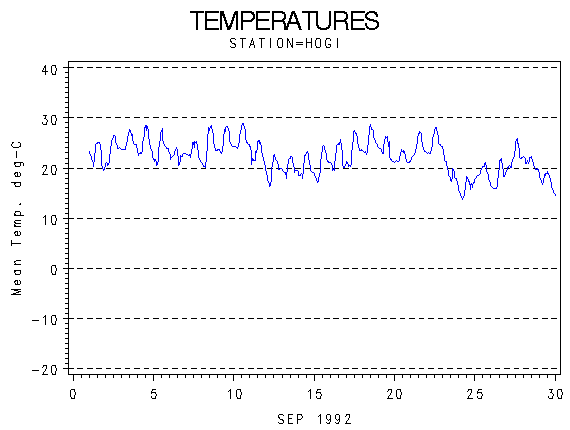 |
| Hourly Mean Temperatures (deg. C) |

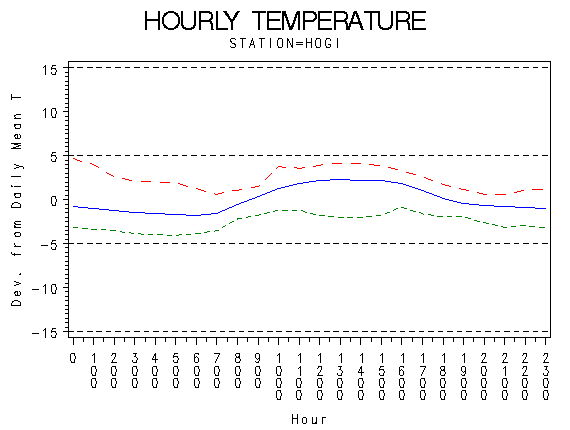 |
| Hourly Max Min and Mean Temperatures (deg. C) |

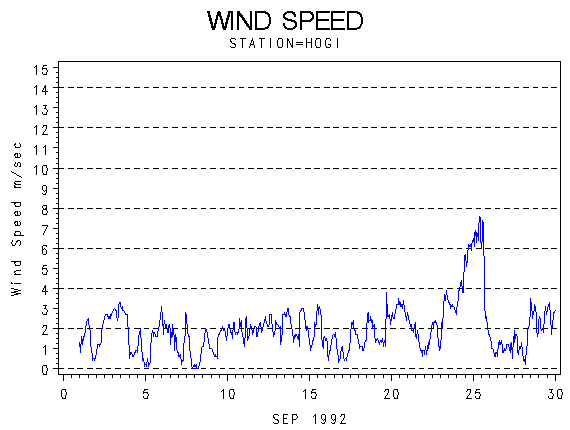 |
| Wind Speed (m/s) |

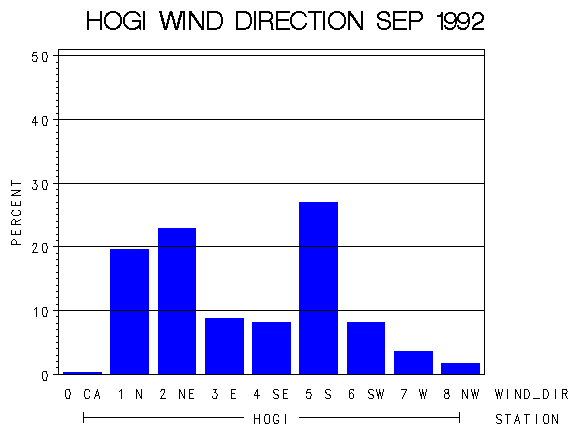 |
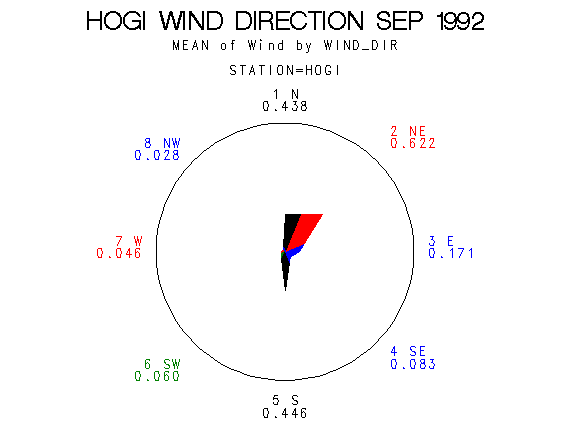
| Frequency of Wind Direction |

 |
| Wind Vectors (circle=1.5 m/s) |

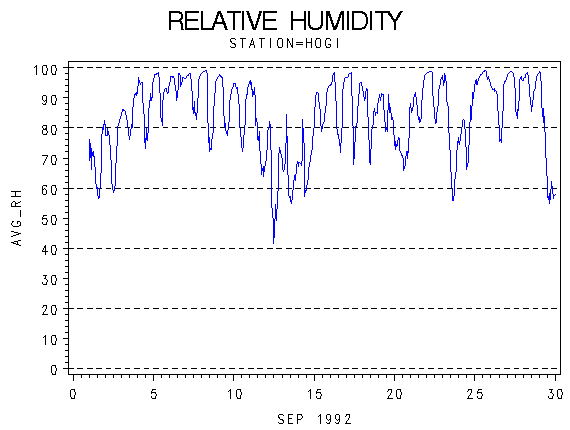 |
| Relative Humidity (percent) |

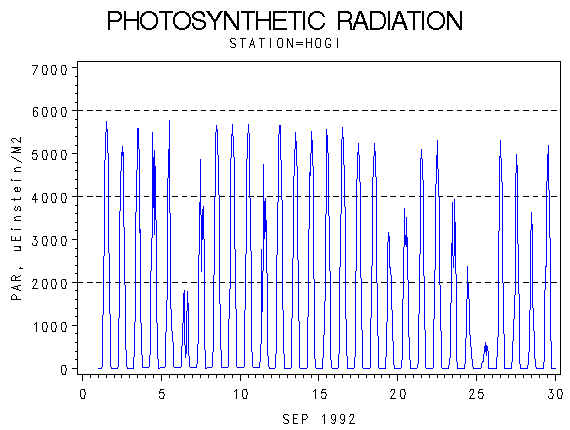 |
| Photosynthetically Active Radiation (micro-einsteins per m squared) |

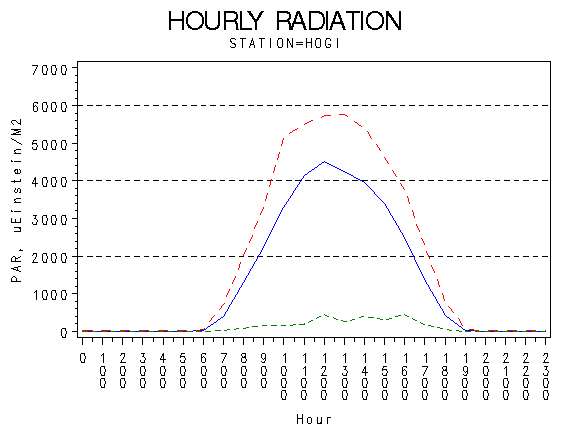 |
| Hourly Photosynthetically Active Radiation (micro-einsteins per m squared) |

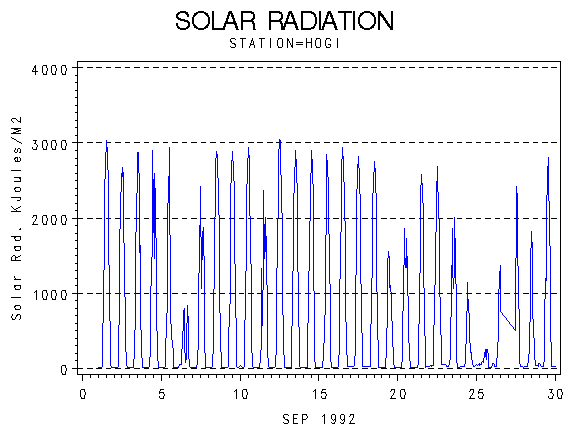 |
| Solar Radiation (KiloJoules per Meter Squared) |

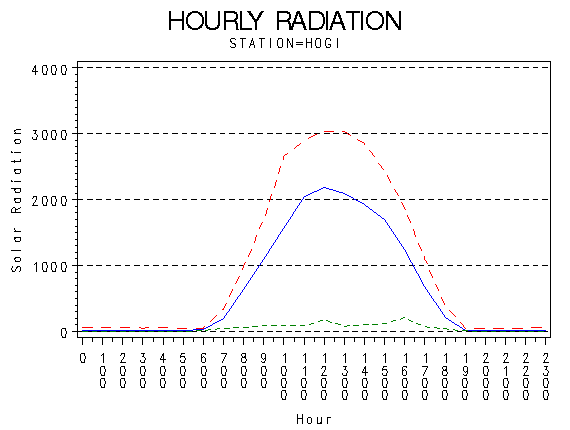 |
| Hourly Solar Radiation (KiloJoules per Meter Squared) |

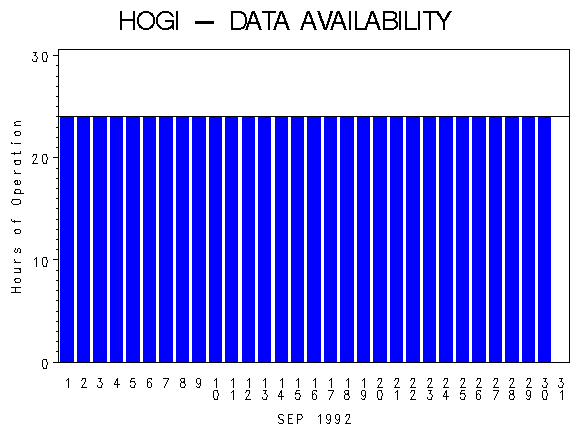 |
| Hours of Station Operation |

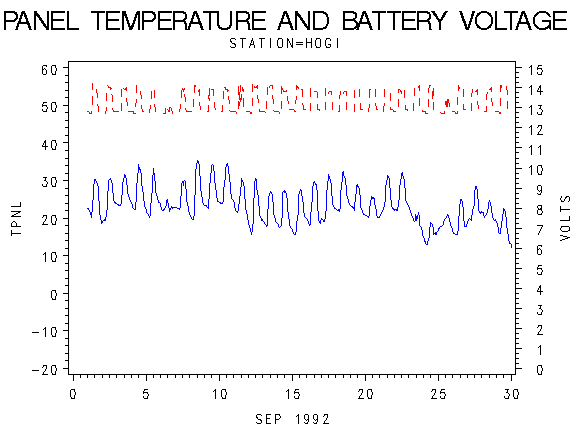 |
| Data Logger Battery Voltage and Internal Logger Temperature |
